


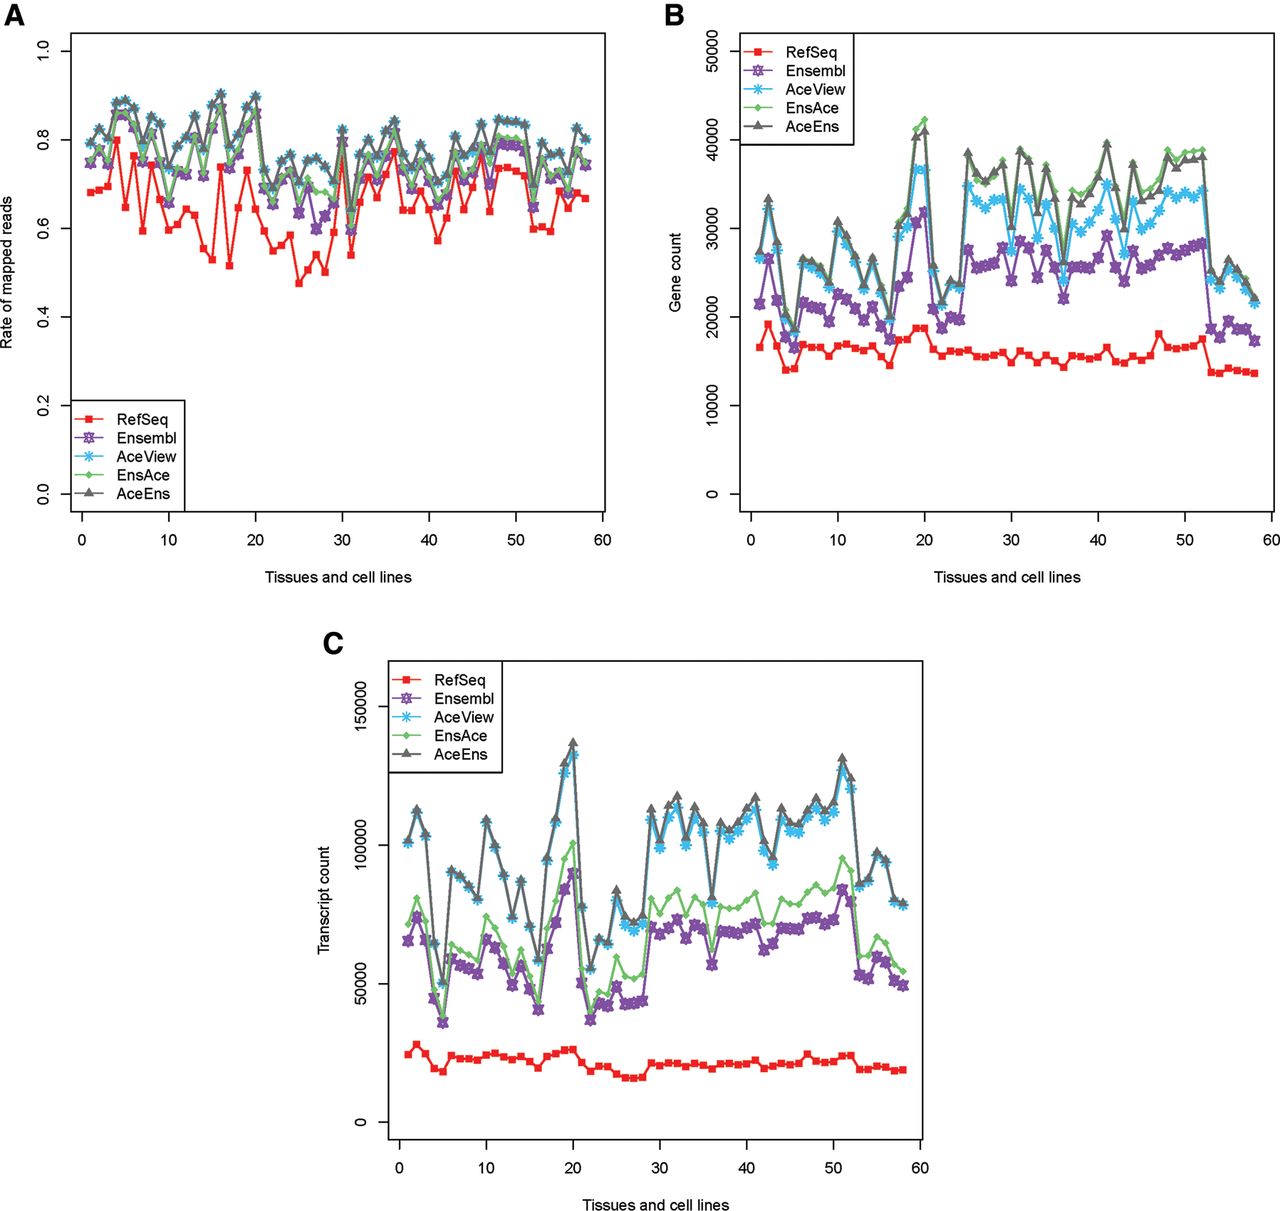
FIGURE 2.
RNA-seq read mapping and expression profile comparison among the five transcriptomes. (A) Short-read mapping rate for RefSeq, Ensembl, AceView, EnsAce, and AceEns using 58 RNA-seq data sets from more than 20 human tissues and cell lines (Supplemental Table 1). (B) Number of expressed genes detected in the five transcriptomes across all 58 data sets. (C) Number of expressed transcripts examined in each data set among the five transcriptomes.




