


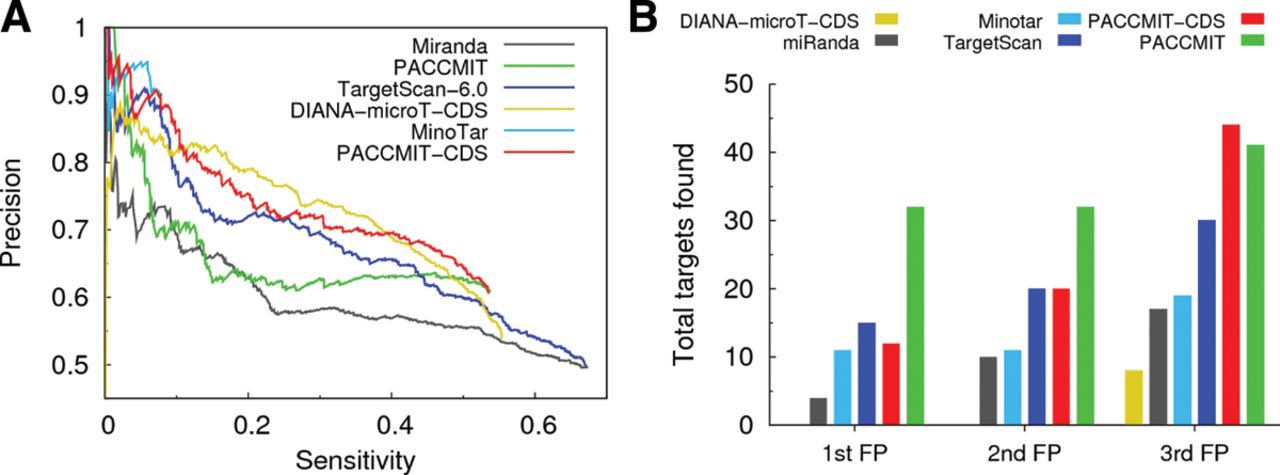
FIGURE 5.
Comparison of different miRNA target prediction algorithms. (A) Precision vs. sensitivity curves for the different methods. (B) Numbers of true positives found before the first, second, and third false positives are found.




