


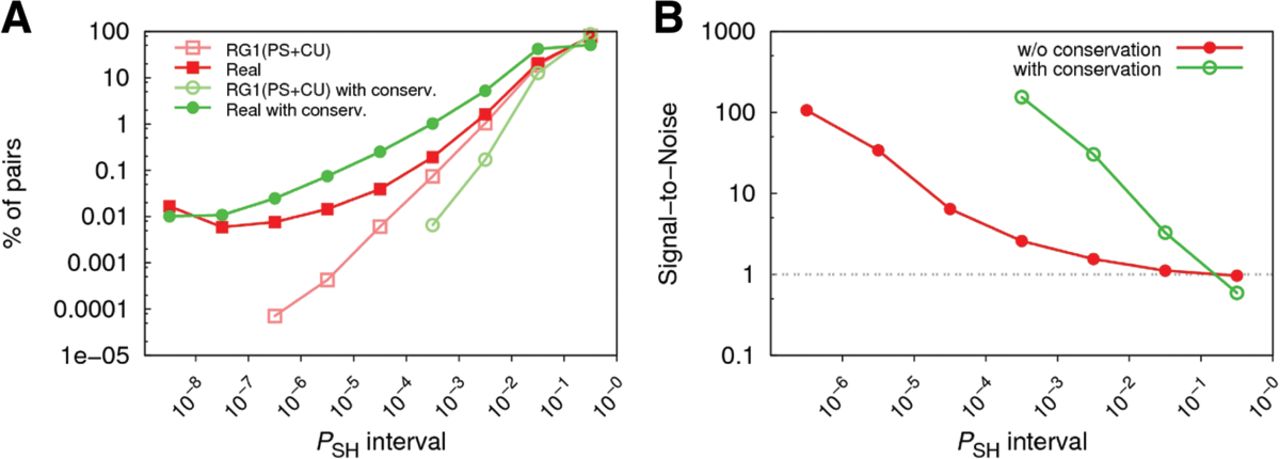
FIGURE 2.
(A) Distribution of predicted miRNA-gene pairs for the real genome and random genome RG1(PS + CU). Results with and without considering site conservation are shown for both genomes. In all cases, PS + CU background is used. (B) Comparison of the signal-to-noise ratios obtained from curves in panel A. The real genome is considered as the signal, whereas RG1(PS + CU) is considered as the noise.




