


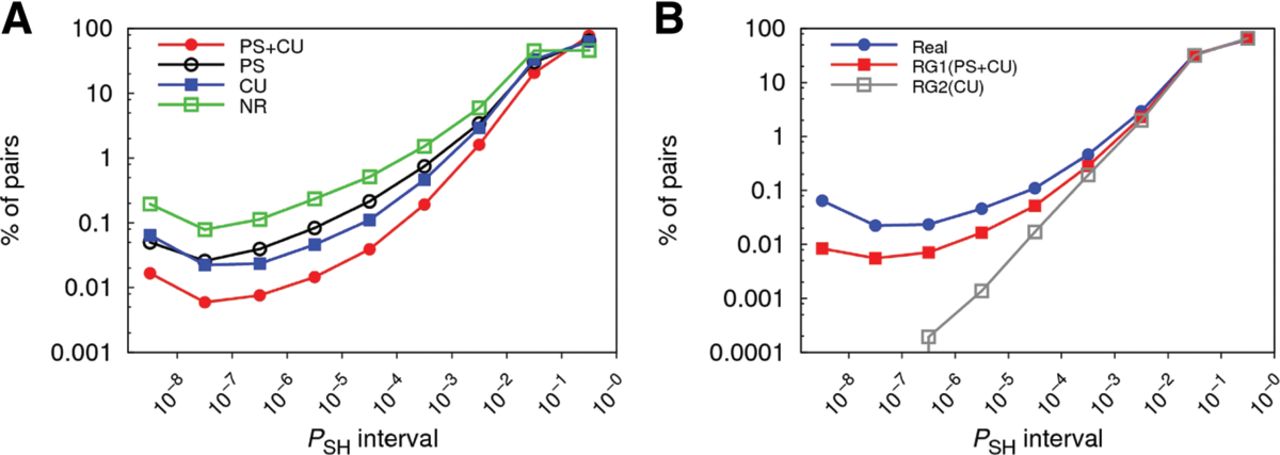
FIGURE 1.
(A) Distribution of predicted miRNA-gene pairs according to their PSH values using four different background models. Percentages are computed with respect to the total number of predicted pairs. (B) Distribution of predicted miRNA-gene pairs for the real and two random genomes. PSH in the three genomes was computed using the CU background. RG1(PS + CU) and RG2(CU) were generated by shuffling the real sequences 1000 times.




