


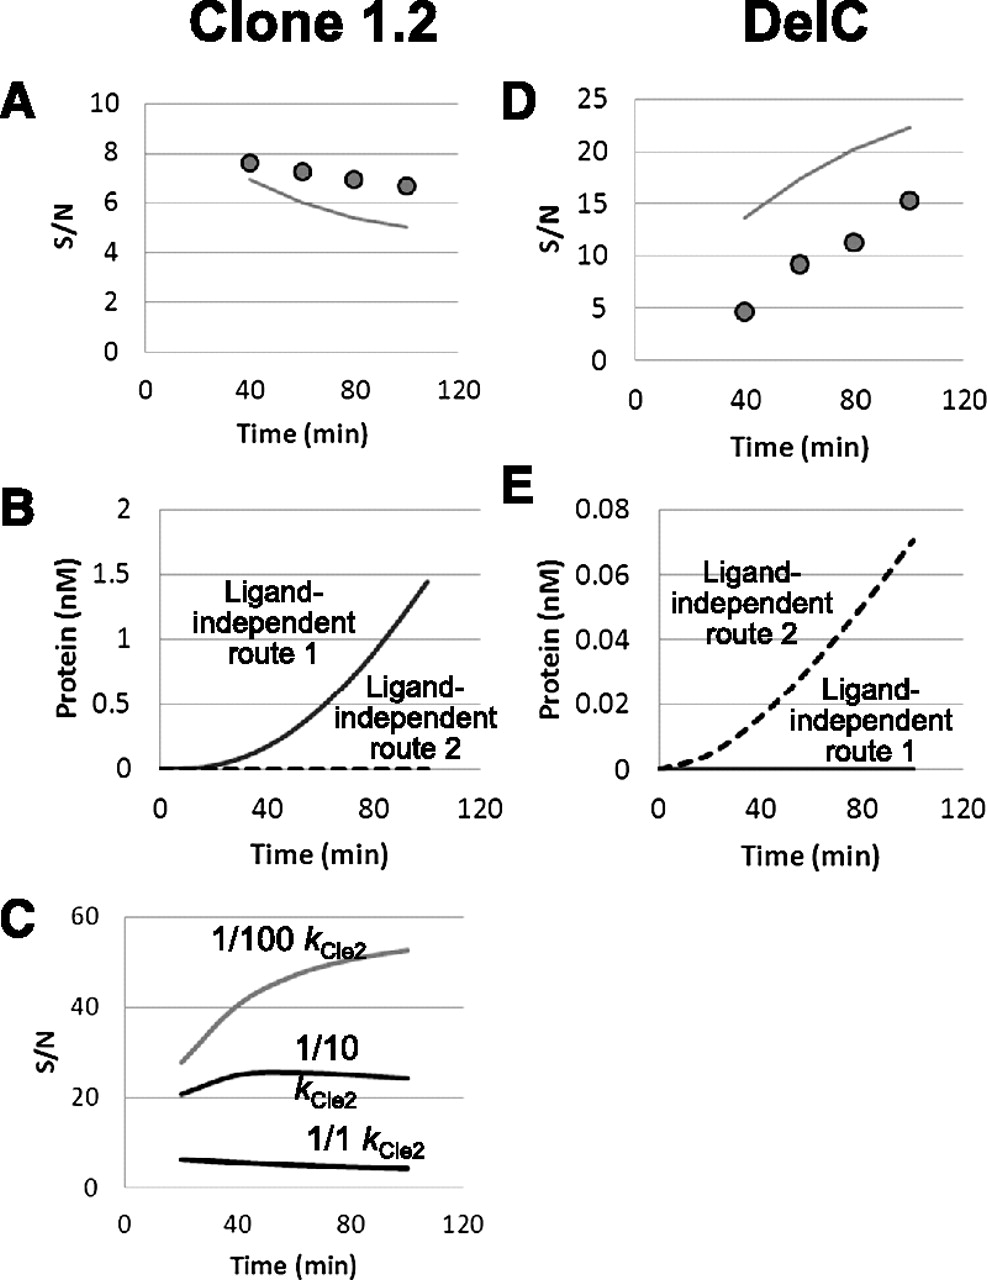
Analysis of the S/N ratio. (Left and right columns) The results for Clone 1.2 (A–C) and DelC mutant (D,E), respectively. (A,D) S/N ratios. The experimental S/N ratios were determined by division of the protein concentration with 1 mM TPP by that with 0 mM TPP in Figure 2D,H (circles). The simulation results of the S/N ratio were obtained using the model shown in Figure 1B and the parameters in Table 1 (lines). (B,E) Contributions of the two ligand-independent routes in Figure 1C for translation in the absence of TPP (Noise). Contributions of ligand-independent route 1 (solid lines) and ligand-independent route 2 (broken lines) were analyzed by simulation using the model and the parameters. (C) Simulation of S/N dynamics with decreased kCle2. Transition of the dynamics of the S/N ratio of Clone 1.2 was simulated by decreasing kCle2, keeping the other parameters unchanged. Note that in this simulation, we assumed that the kPro2 value of Clone 1.2 was the same as that of the DelC mutant (0.0034/min), because the value of Clone 1.2 was not determined.




