


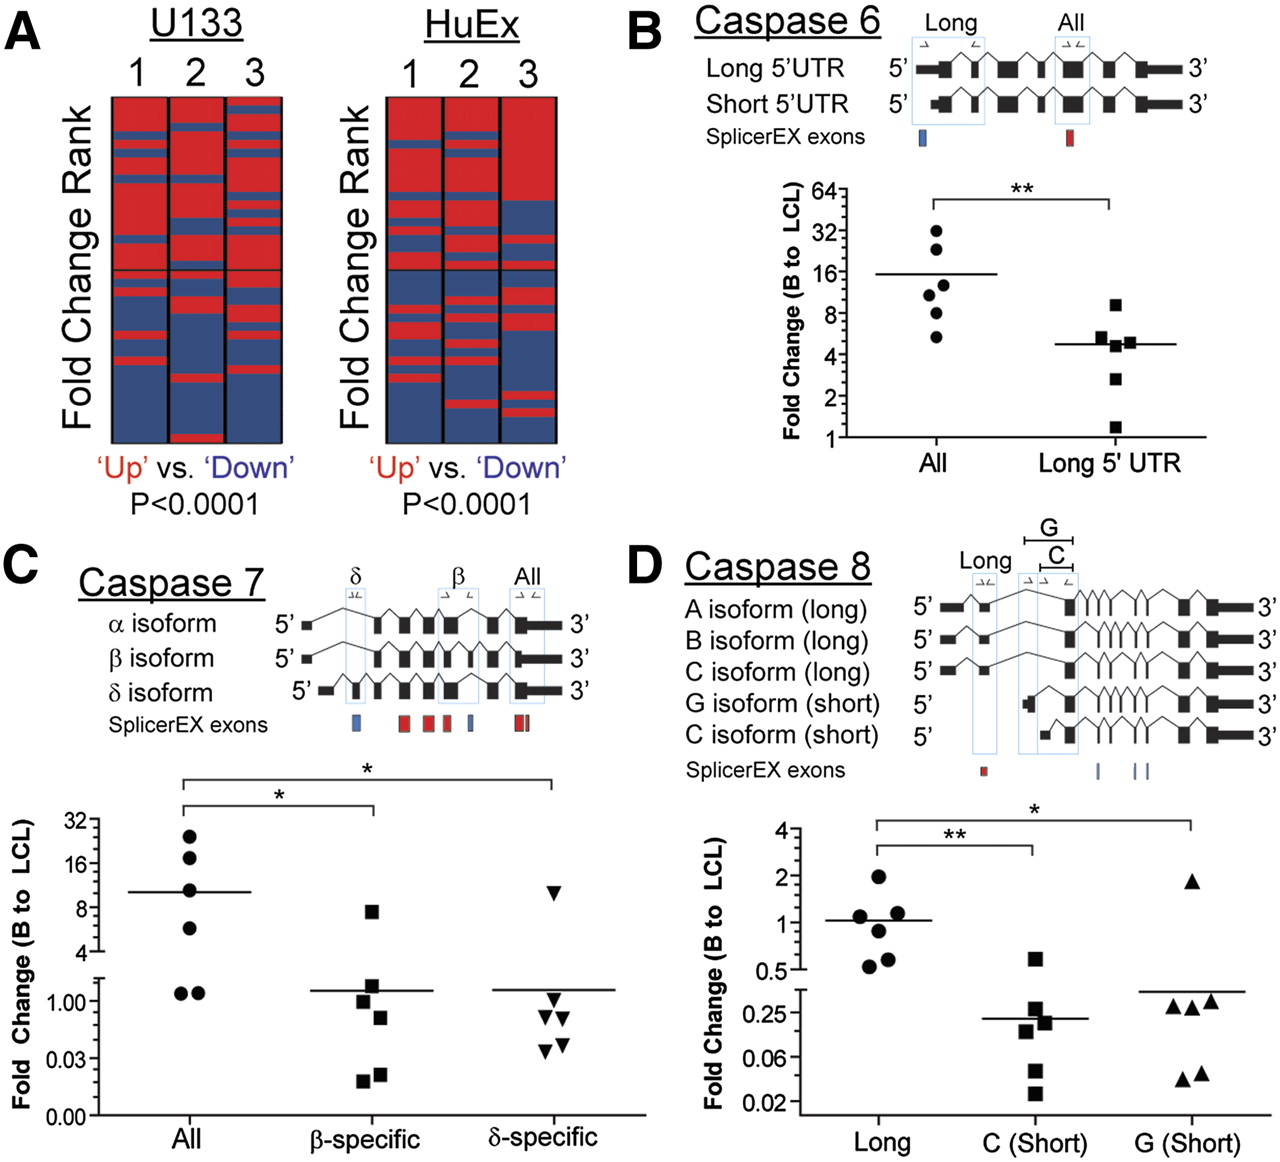
Quantitative RT-PCR validation of SplicerEX-predicted U133 and HuEx mRNA isoform changes. (A) The heatmaps display the fold-change rank order (from top to bottom) of 40 qRT-PCR reactions (20 “Up” and 20 “Down” for each gene) on each platform (U133 on left and HuEx on right) for three independent donors. Each reaction measures the fold change of mRNA between B cell and LCL for either the Up event (red) or the Down events (blue). If all Up reactions were ranked above the Down reactions, then the heatmap would be red on the top half and blue on the bottom half. The P-value shown is from the Mann-Whitney U-test, which was used to compare the set of Up reactions to the set of Down reactions. (B) A schematic diagram is shown for two caspase 6 mRNA isoforms predicted based on our SplicerEX data. The primer locations for qRT-PCR are indicated above, and SplicerEX meta-probe sets are displayed below (Up exons [red]; Down exons [blue]). Below the schematic is a graph plotting the fold change from B to LCL for qRT-PCR reactions characterizing the isoform change in six independent human donors. (**) p < 0.01 (Mann-Whitney). (C) As in B, a schematic diagram of caspase 7 mRNA isoforms is shown including primers for qRT-PCR and SplicerEX meta-probe sets. The graph indicates B-to-LCL fold-change values for reactions characterizing all isoforms, β-specific isoforms, or δ-specific isoforms. (*) p < 0.05 (Mann-Whitney). (D) As in B and C, a schematic diagram of caspase 8 mRNA isoforms is shown including primers and SplicerEX meta-probe sets. The graph plots B-to-LCL fold-change values for reactions characterizing long, C (short)–specific, and G (short)–specific isoforms. (*) p < 0.05; (**) p < 0.01 (Mann-Whitney).




