


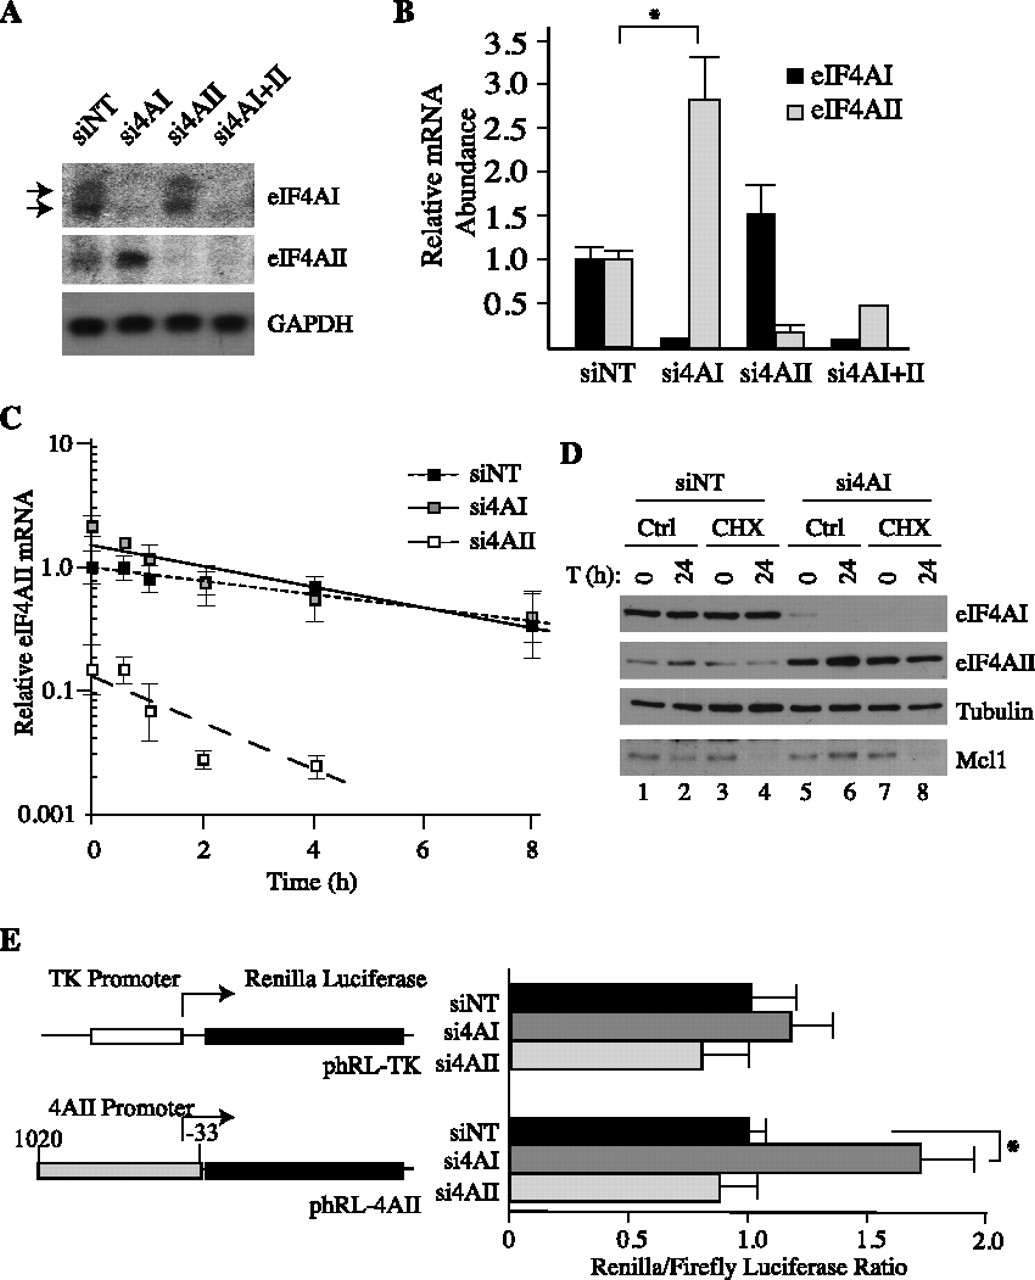
Suppression of eIF4AI is associated with increased eIF4AII transcription. (A) Northern blot analysis of eIF4AI/II mRNA levels in HeLa cells following knockdown of eIF4AI and eIF4AII. RNA was isolated from HeLa cells 48 h after transfection with the indicated siRNAs, fractioned on a formaldehyde/agarose gel, and transferred to a Hybond N+ membrane. The presence of eIF4AI/II and GAPDH mRNAs was probed by Northern blotting. Two isoforms of eIF4AI (NM_001416: polyadenylation signals at 1473 and 1855), due to use of alternative polyadenylation sites (Nielsen et al. 1985), are indicated by arrowheads. The two polyadenylated isoforms of eIF4AII (NM_001967: polyadenylation signals at 1738 and 1868) (Nielsen and Trachsel 1988) are not resolved in this gel system. (B) RT-qPCR analysis of eIF4AI/II levels from HeLa cells suppressed for eIF4AI and/or eIF4AII expression. Values are standardized to GAPDH and set relative to those obtained in siNT-transfected HeLa cells. n = 3; (*) P = 0.04. (C) Determination of eIF4AII mRNA half-life in HeLa cells. HeLa cells were transfected with the indicated siRNAs, and 48 h later, Act D (5 μg/mL) was added to the cells for the indicated time periods. Total RNA was isolated and subjected to RT-qPCR. Values are set relative to those obtained before addition of Act D and represent the average of three measurements. Data are presented as a semi-log plot. Error bars, SEM. Exponential regression analysis was used to determine mRNA half-life. (D) Assessment of eIF4AII protein stability upon eIF4AI knockdown. HeLa cells were transfected with the indicated siRNAs, and 48 h later, CHX (10 μM) was added for 24 h. Total protein extracts were prepared, fractionated by SDS-PAGE, and analyzed by Western blotting. α-eIF4AI, ab31217. (E) Transient transfection assay assessing eIF4AII promoter response to eIF4AI suppression. HeLa cells were first transfected with reporter plasmids and 24 h later with the indicated siRNAs. Cell extracts were prepared 55 h after siRNA transfection, and luciferase activities were measured. Renilla activity was normalized to firefly luciferase activity. n = 4; (*) P < 0.0001. Error bars, SEM.




