


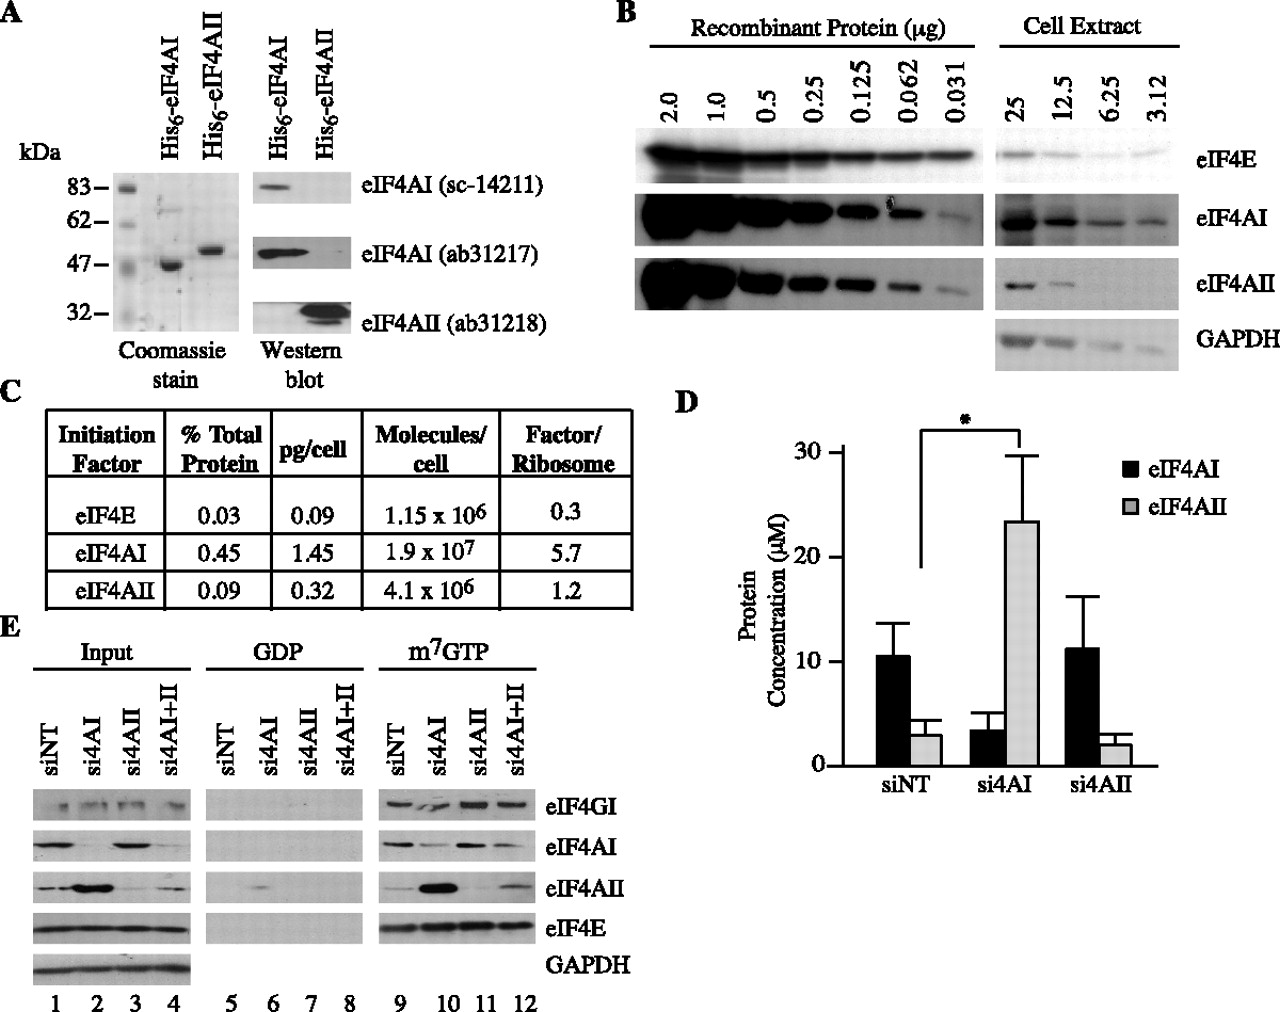
Quantitation of eIF4AI/II in HeLa cells upon RNAi-mediated knockdown of eIF4AI and eIF4AII. (A) Characteristics of isoform-specific and anti-eIF4AI/II antibodies used in this study. (Left) SDS-PAGE analysis of purified His6-eIF4AI and His6-eIF4AII. The difference in mobility between the two isoforms is due to contribution to the His6-eIF4AII recombinant protein mass from vector-derived sequence (Bordeleau et al. 2005). (Right) Western blot analysis using anti-eIF4AI (sc-14211), anti-eIF4AI (ab31217), and anti-eIF4AII (ab31218) antibodies. (B) Quantitation of endogenous eIF4E and eIF4AI/II in HeLa cells. The indicated amounts of recombinant protein and lysates were analyzed by Western blotting. Signals obtained by chemiluminescence were quantitated using an AlphaImager HP. Shown is one of four representative experiments. α-eIF4AI, sc-14211. (C) Table indicating levels of eIF4E, eIF4AI, and eIF4AII proteins in exponentially growing HeLa cells. Values represent the average of four independent determinations. (D) Quantitation of eIF4AI/II levels by comparative Western blotting from HeLa cell extracts that had been transfected with the indicated siRNAs. The ordinate axis indicates the calculated eIF4AI/II concentration/cell. The average volume of a HeLa cell was taken to be 3.4 pL (Deman et al. 1976). n = 4; (*) P < 0.0001. (E) m7GTP affinity purification of the eIF4F complex from HeLa cells transfected with the indicated siRNAs. Western blots were performed on an aliquot of the input extract (lanes 1–4), GDP eluents (lanes 5–8), and m7GTP eluents using the indicated antibodies (lanes 9–12). α-eIF4AI, sc-14211.




