


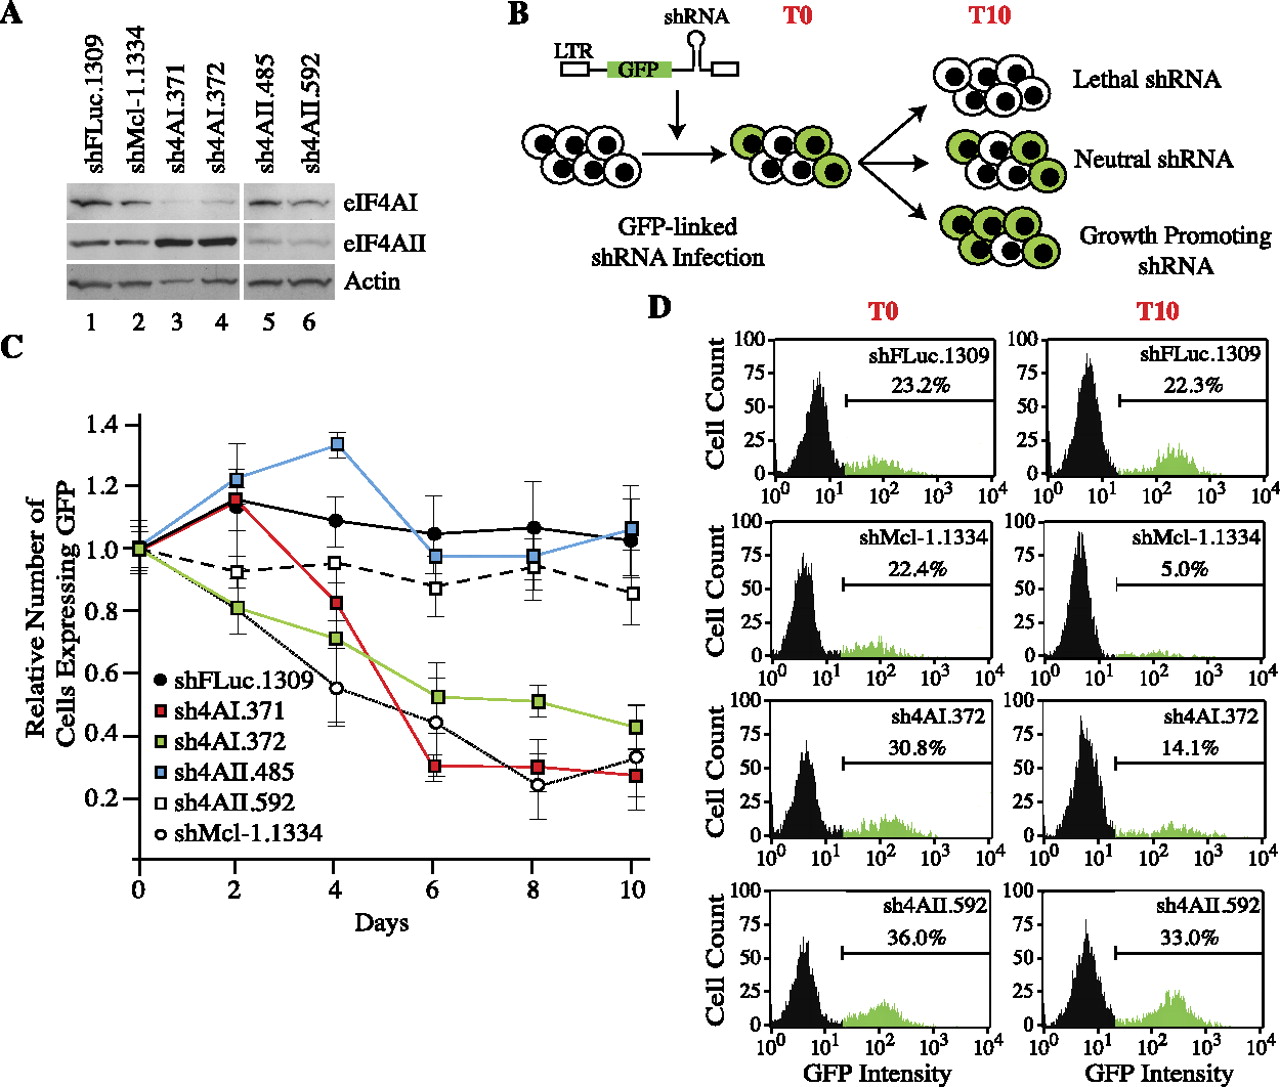
Suppression of eIF4AI in Myc-driven lymphomas is disadvantageous in a competitive growth assay. (A) Western blot assessing knockdown of eIF4AI and eIF4AII in Tsc2+/−Eμ-Myc lymphomas. Cells were infected with MLS-based retroviruses; 2 d later, the GFP+ population was enriched by cell sorting, and total protein extracts were prepared and analyzed by Western blotting. Panels are from the same blot but juxtapositioned for clarity. α-eIF4AI, sc-14211. (B) Schematic diagram of cell competition assay used to assess consequences of eIF4AI/II suppression on cell growth and viability. (C) Flow cytometry analysis of Tsc2+/−Eμ-Myc lymphomas infected with retroviruses expressing the indicated shRNAs. The first time point (T = 0 d; T0) was set 48 h after the first infection and used to normalize the data. Error bars, SEM; n = 3. (D) Examples of flow cytometry results taken from T0 and T10 for Tsc2+/−Eμ-Myc lymphoma cells infected with the indicated shRNAs. The percentage of GFP+ cell population is denoted.




