


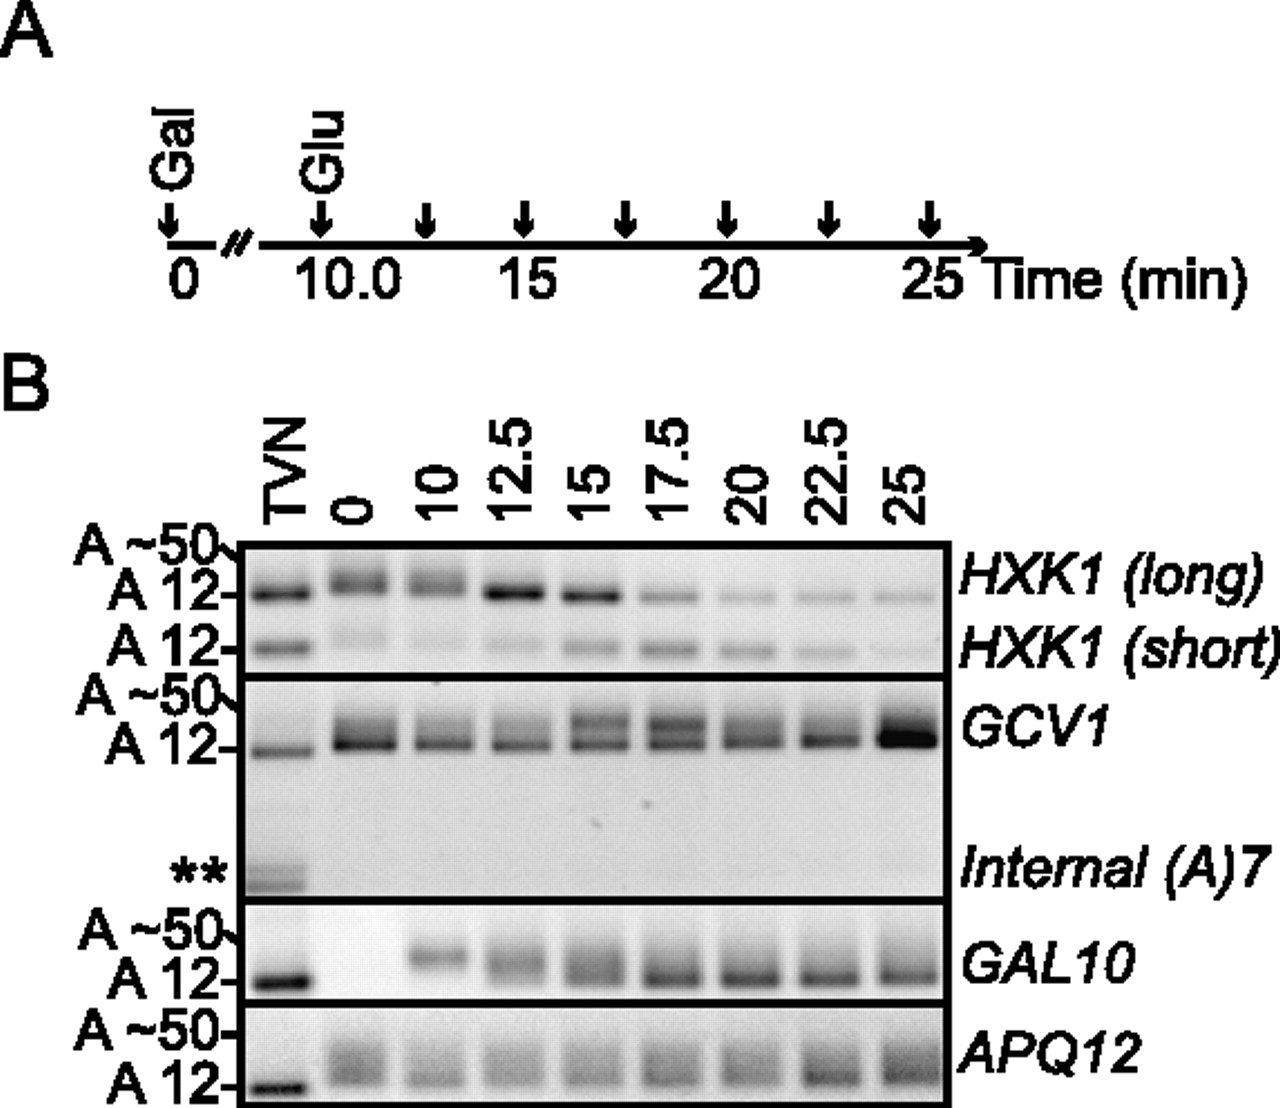
Alternate polyadenylation sites are revealed by ePAT. (A) Schematic representation of the time course of galactose induction and glucose repression. The arrows indicate the time points at which cells were harvested. (B) HXK1 transcription is rapidly repressed by glucose. During this repression phase, the ratio between HXK1-(long) and HXK1-(short) changes as the short 3′ UTR form is transiently induced without a significant increase in poly(A)-tail length. GCV1 is transiently induced with a long poly(A)-tail by glucose addition. The faster migrating GCV1 amplicon, indicated by **, is likely a product of internal priming in the TVN reaction. The GAL10 and APQ12 panels are included as pulse-chase and ePAT assay controls, respectively.




