


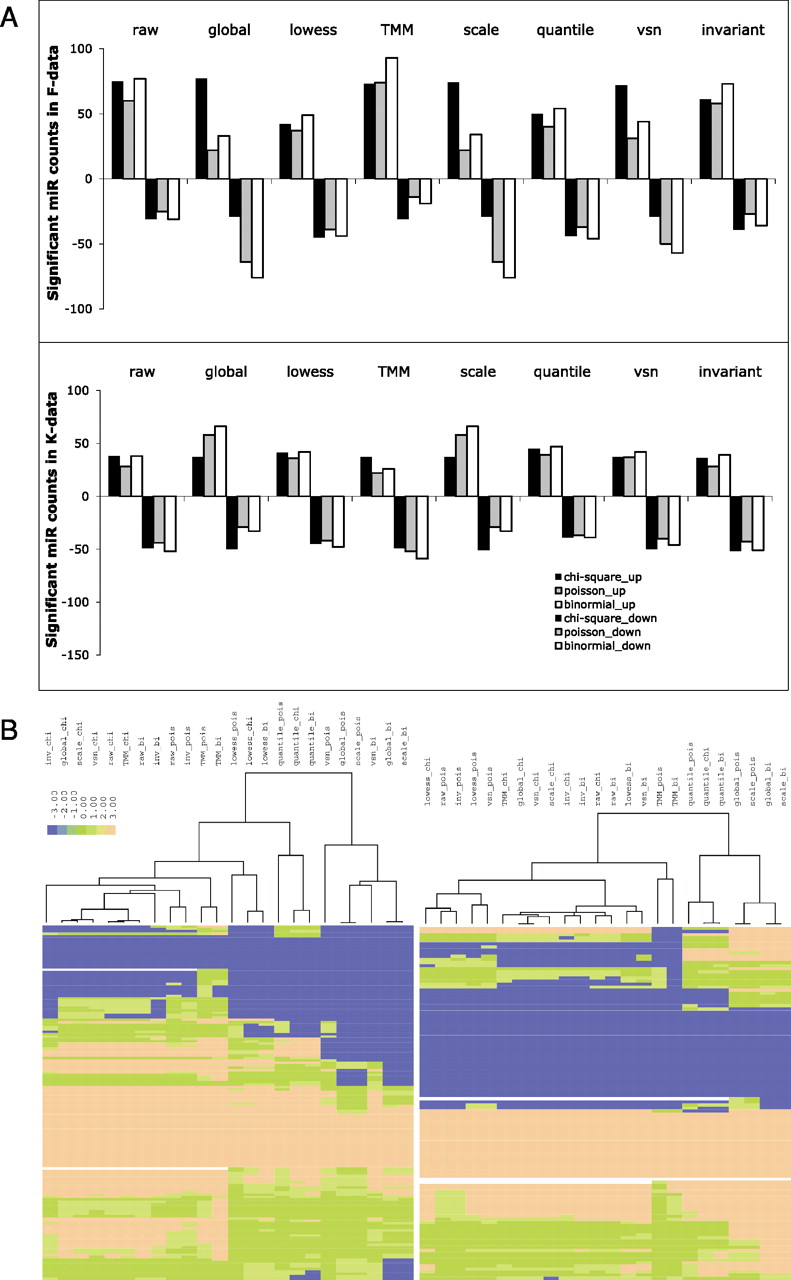
Test of differential expression based on different normalizations. (A) Bar graphs show the results of DE based on χ2/Fisher's test (chi-square), Poisson model (poisson), and binomial model (binomial) for different normalization schemes. The color codes for the tests of DE are as follows: black bar (χ2), gray bar (Poisson), and empty bar (binominal). The normalization methods upon which the DE tests are performed are listed above the bars. “Up-regulated” microRNAs are plotted above y = 0 and “down-regulated” microRNAs below y = 0. The top plot is from F-data, and the bottom plot from K-data. (B) Heat maps show the hierarchical clustering results of all significant microRNAs that are defined in A. The values are transformed from P-values of specific microRNAs. Blue color represents down-regulation whereas brown color represents up-regulation. pois, Poisson model; bi, binomial model; and chi, χ2/Fisher's test.




