


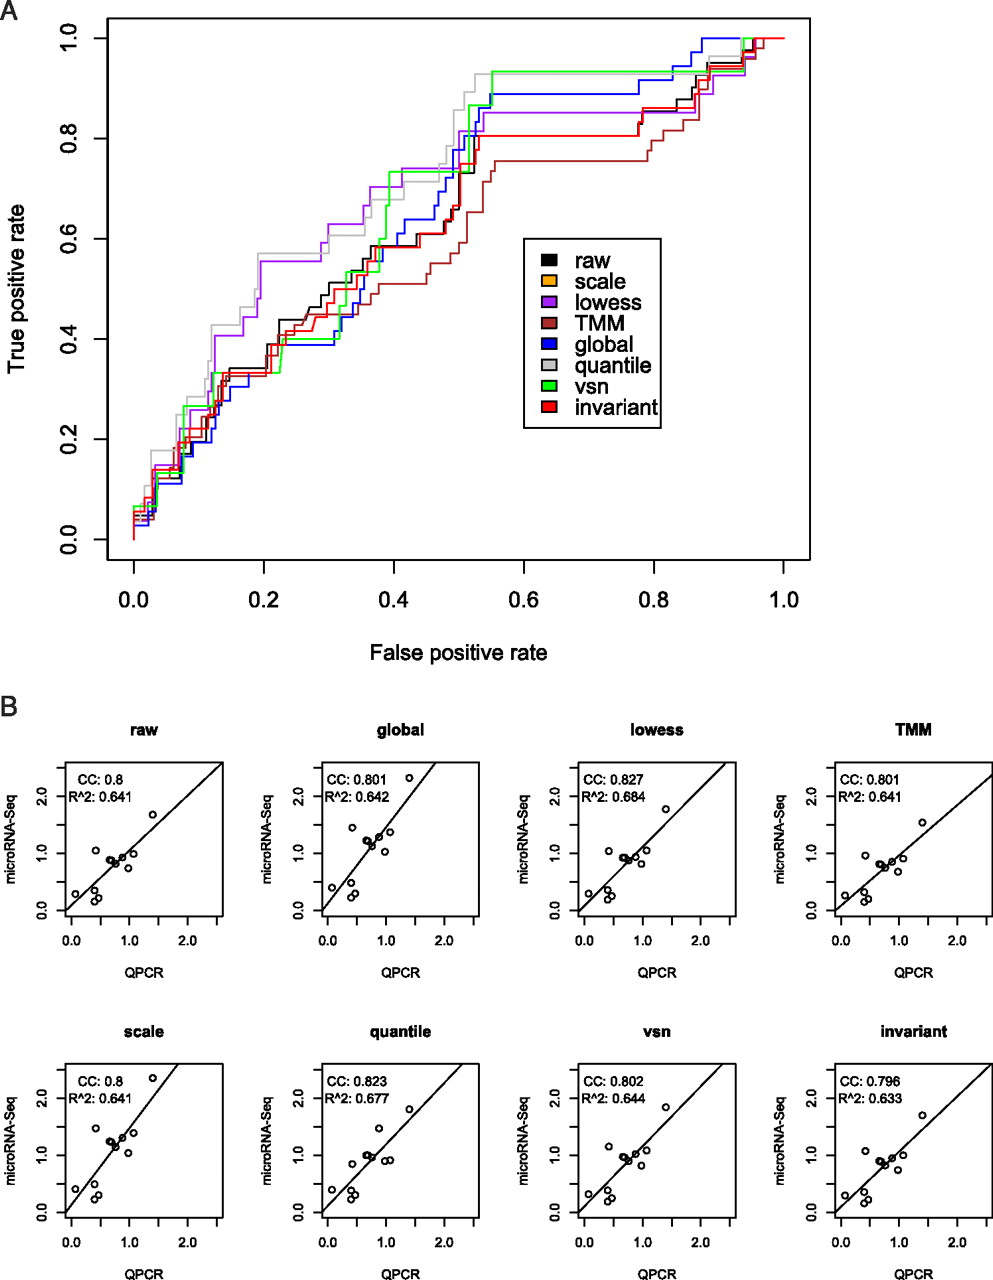
Evaluation of normalization methods with QPCR results. (A) ROC plot of sensitivity and specificity of the various normalization methods, based on F-data. The color codes of ROC curves for the normalization methods are the same as those in Figure 2. A “true difference” of value 1 is assigned to the microRNAs whose QPCR expression ratios are at least twofold different between activated and inactivated state, but 0 otherwise. A “predicted difference” is the absolute value of the normalized M-value of microRNA-Seq tag counts. Note: the ROC curves of the scaling and global normalization methods are identical and the global normalization (blue) is superimposed on the scaling method (orange). (B) Linear regression of microRNA-Seq log2 fold change results versus QPCR log2 fold change results based on K-data, over various normalization methods. The correlation coefficient (CC) and R-square (R^2) are two metrics to measure the correlation between the two types of data. The lines are the best linear regression fits to the data. For comparison, all x- and y-axes are uniformized to the same scales.




