


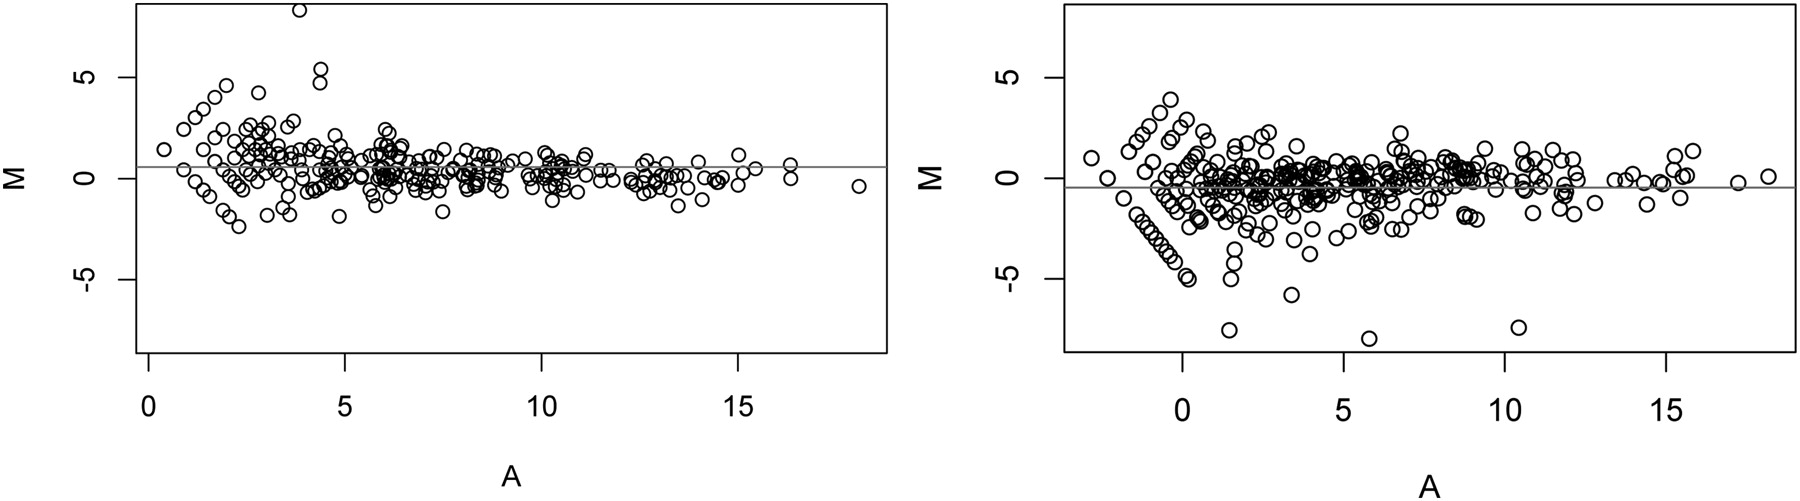
FIGURE 1.
MA-plots after simple tag count normalization. MA-plots show the distribution of microRNAs in paired samples of comparison after the simple total tag count normalization among the known, detectable microRNAs. The horizontal lines denote the mean of the M-values, which are significantly deviated from zero in both data sets, with a median of 0.57 for F-data (left) and −0.47 for K-data (right).




