


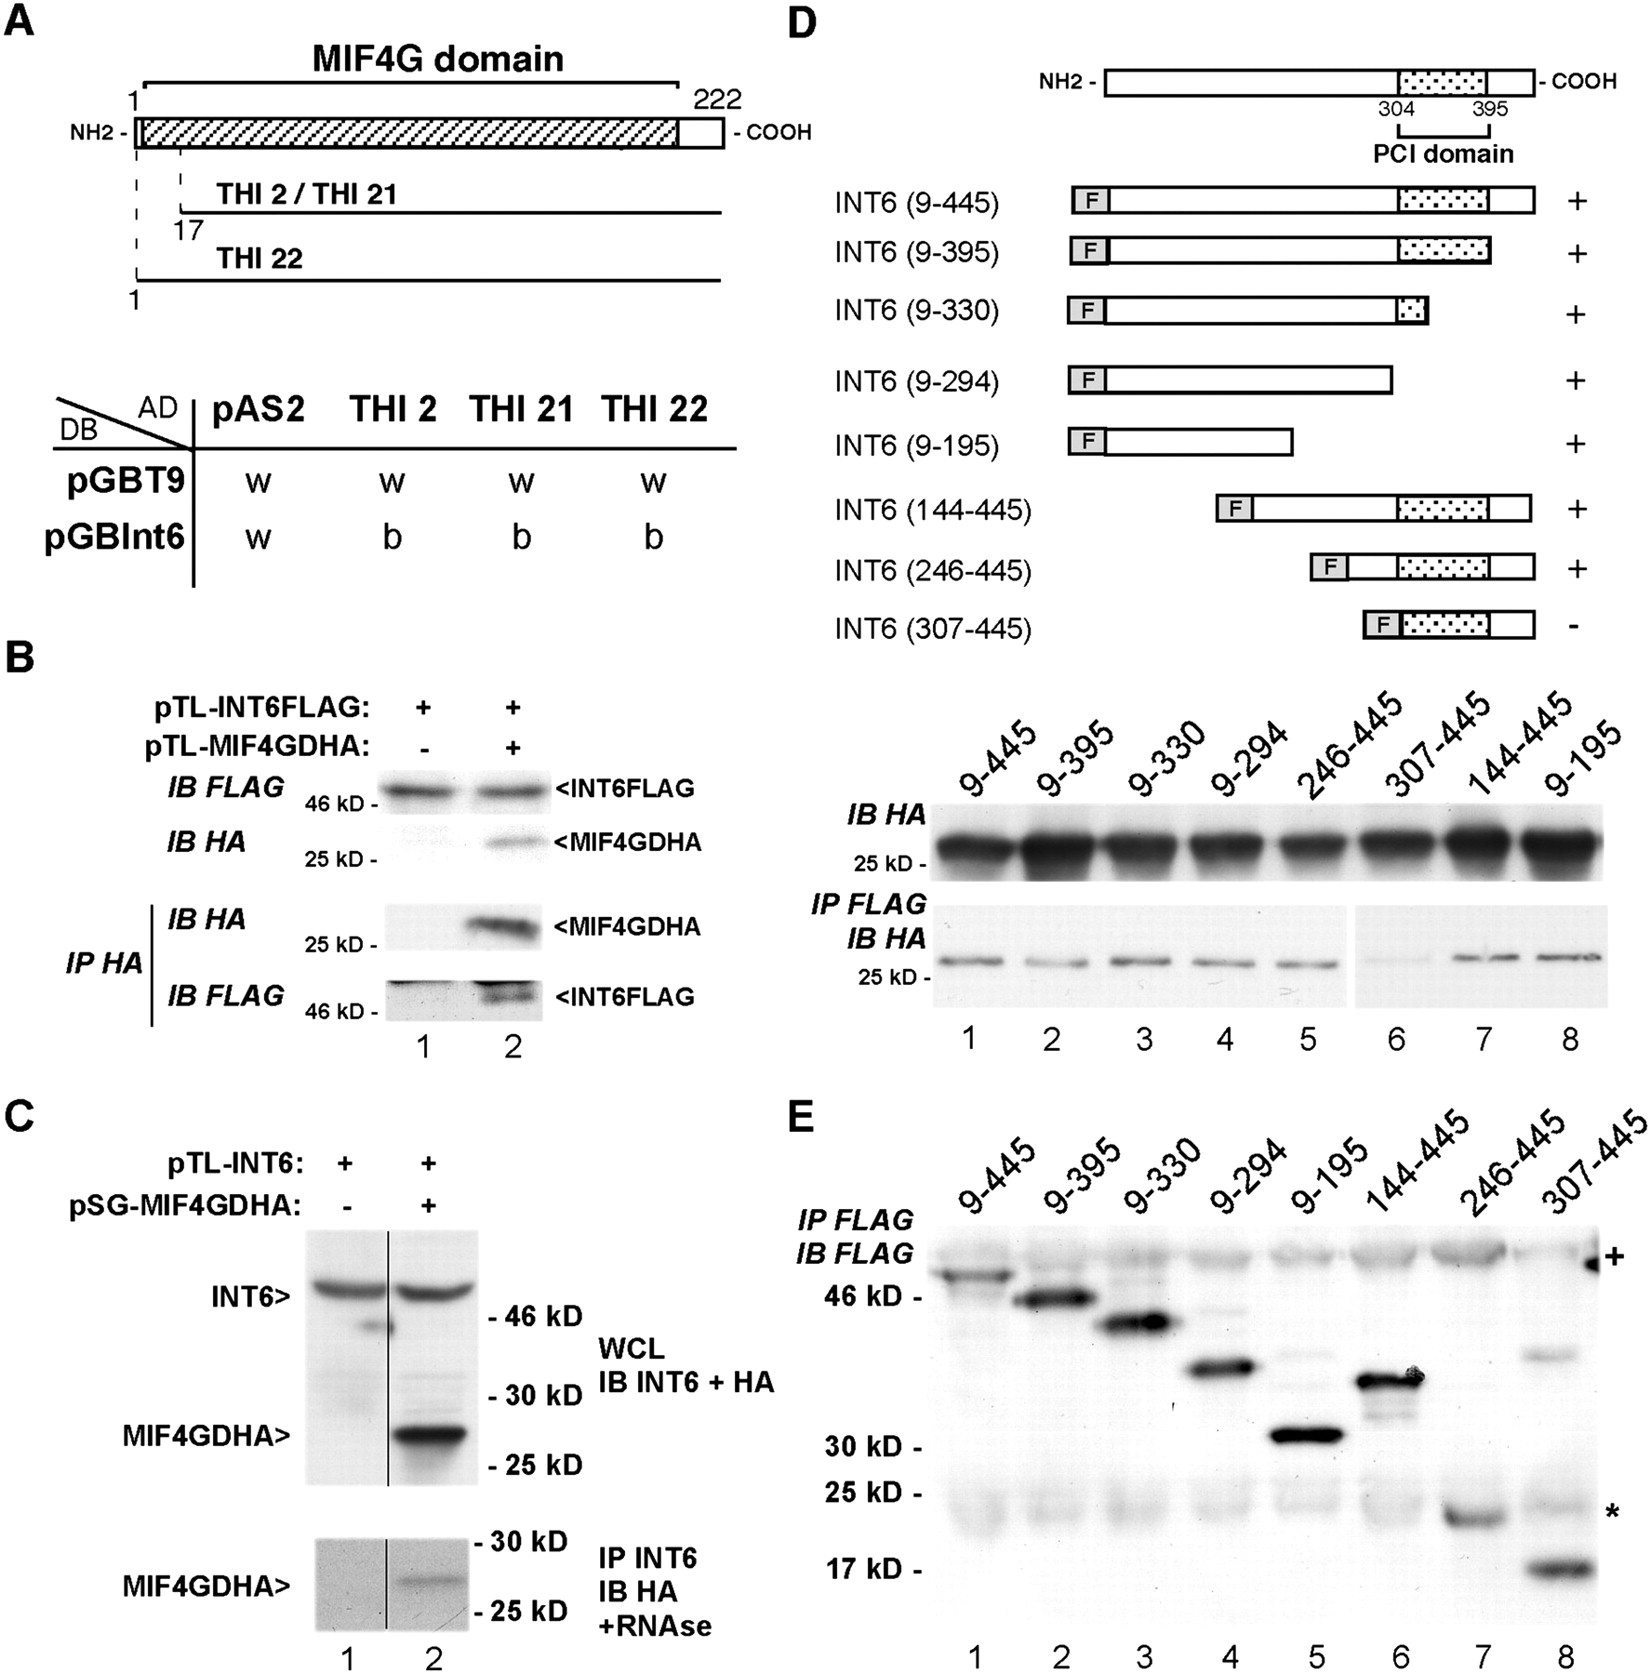
The MIF4GD protein interacts with INT6. (A) Schematic representation of the three clones encoding MIF4GD identified by two-hybrid screen with INT6 as bait. The table represents the results of testing these clones by two-hybrid with vectors expressing the GAL4 DNA binding domain alone (pGBT9) or in fusion with INT6 (pGBInt6). As control, the assay was also performed with a vector expressing the GAL4 activation domain alone (pAS2). The letters w (white) and b (blue) indicate the color of the colonies after 24 h. (B) HeLa cells were transfected with the pTL1-INT6FLAG construct, alone (lane 1) or together with the MIF4GDHA expression vector (lane 2). To monitor expression, cell lysates were analyzed by immunoblot with antibodies to Flag (top panel) and to HA (second panel from top). Cell lysates were immunoprecipitated with the antibody to HA, and precipitated proteins were analyzed by immunoblot using the antibody to Flag (bottom panel) and to HA to verify efficiency of immunoprecipitation (third panel from top). (C) COS7 cells were transfected with the pTL-INT6 (lanes 1 and 2) and pSG-MIF4GDHA (lane 2) expression vectors. Whole cell lysates were analyzed by immunoblot using a mix of antibodies to INT6 and HA (top panel). These lysates were used to perform immunoprecipitation using the antibody to INT6 (C20) in the presence of RNAse A. Immunoprecipitates were analyzed by immunoblot using the monoclonal antibody to HA (bottom panel). The positions of the INT6 and MIF4GDHA signals are indicated. (Vertical black line) The two represented lanes were from the same blot but not in adjacent lanes. (D) Schematic representation of several INT6 deletion mutants fused to the Flag epitope. COS7 cells were transfected with the MIF4GDHA expression vector together with the constructs expressing the various parts of INT6 fused to Flag as indicated. Lysates of these cells were used to perform immunoprecipitations with the antibody to Flag and immunoblot analysis with the antibody to HA. (E) The Flag immunoprecipitates of panel D were analyzed by immunoblot using a monoclonal antibody to Flag. The star and the cross on the right indicate nonspecific bands corresponding to the immunoglobulin heavy and light chains. The positions of the bands of a molecular weight marker run in parallel are indicated on the left.




