


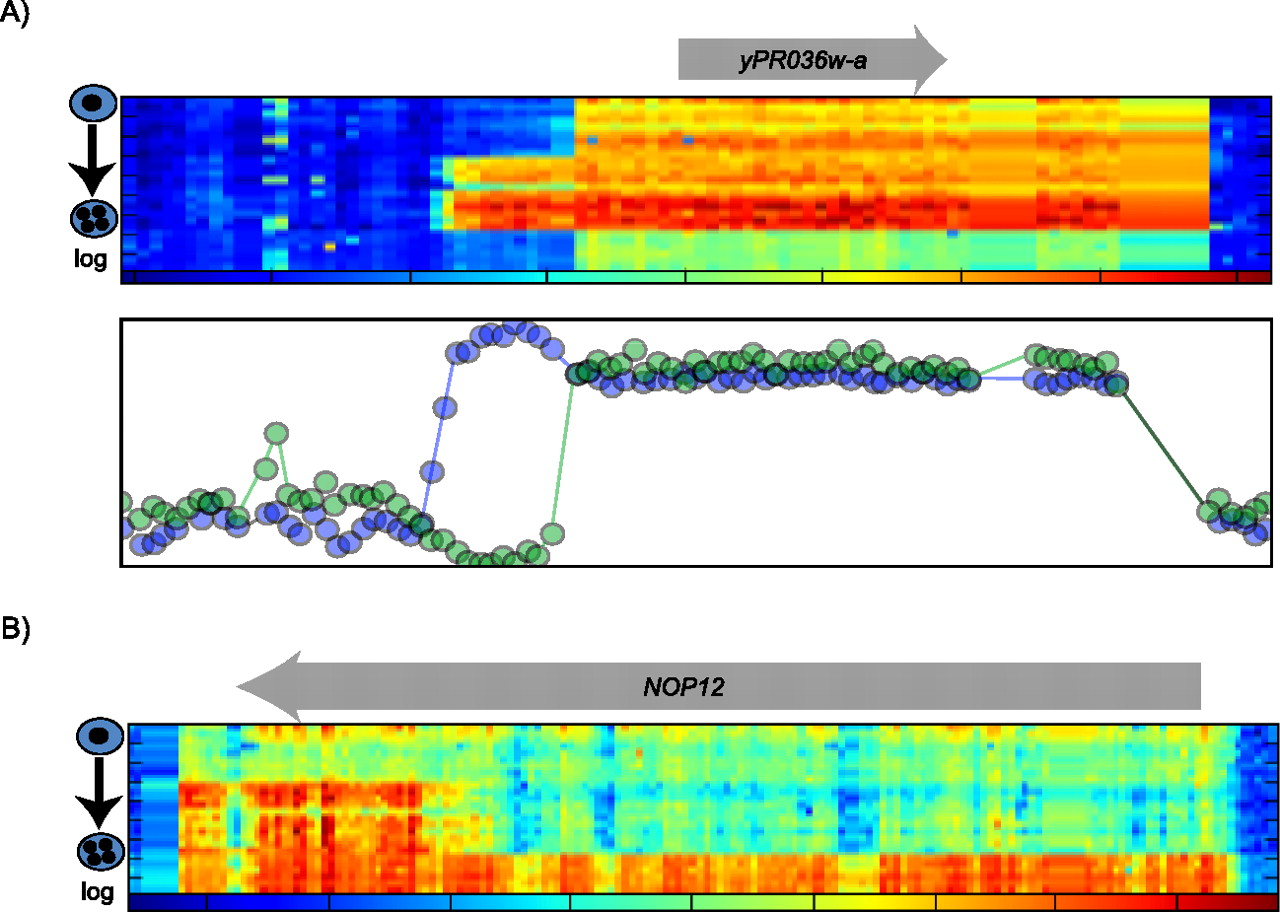
FIGURE 2.
Factorization of segments to identify architecture changes at the 5′ end. (A) Each segment identified was subjected to NNMF analysis to identify potential changes in transcript architecture. An example of an architecture change at the 5′ end is shown at the yPR036w-a locus. The factorization can be visualized as a map function seen directly below the heat map of the segment. All segment heat maps and NNMF maps can be viewed at http://groups.molbiosci.northwestern.edu/sontheimer/sk1meiosis.php. (B) An example of extreme 5′ end regression at the NOP12 locus.




