


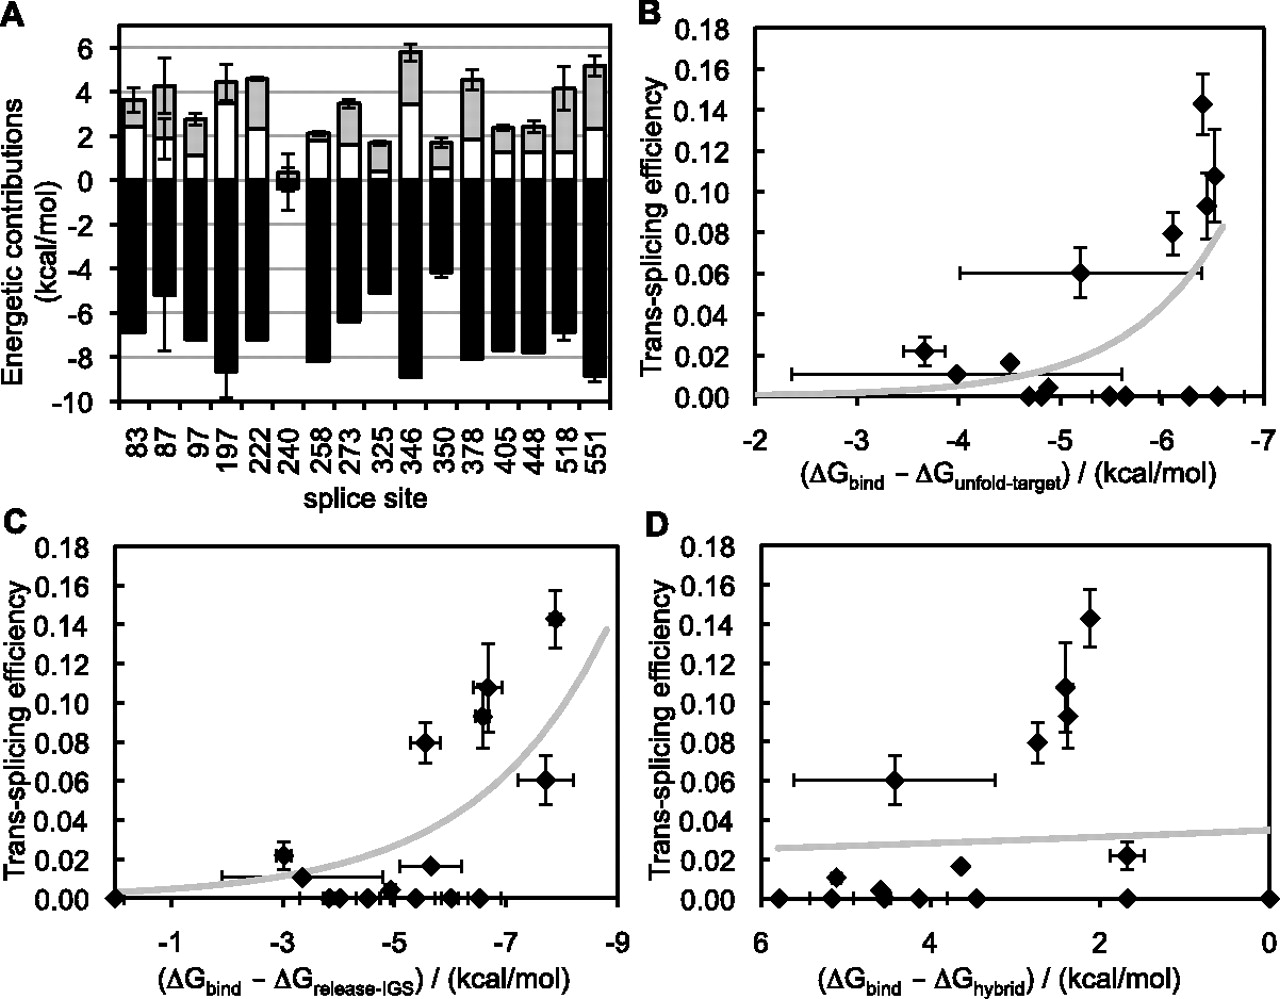
Energetic contributions to the computed binding free energy on CAT mRNA, from the three molecular events described in Figure 1A. (A) The computed energetic contributions from target site unfolding (ΔGunfold-target, gray), ribozyme IGS release (ΔGrelease-IGS, white), and IGS-target site hybridization (ΔGhybrid, black) are shown for each tested splice site. Three of the 18 tested splice sites were omitted (131, 240, 369) because their computed energetic values were not among the strongest 10,000 interactions reported by IntaRNA. Error bars are standard deviations of the energies calculated with three to six different window sizes as in Figure 3. (B–D) Plots of trans-splicing efficiency as a function of computed ΔGbind values when the contribution of (B) ΔGunfold-target, (C) ΔGrelease-IGS, and (D) ΔGhybrid is omitted in turn. The thick gray lines in B–D represent exponential fits, as in Figures 3B and 4B, with coefficients of determination R2 = 0.38, 0.57, and 0.076 for B, C, and D, respectively. For additional details, see Figure 3.




