


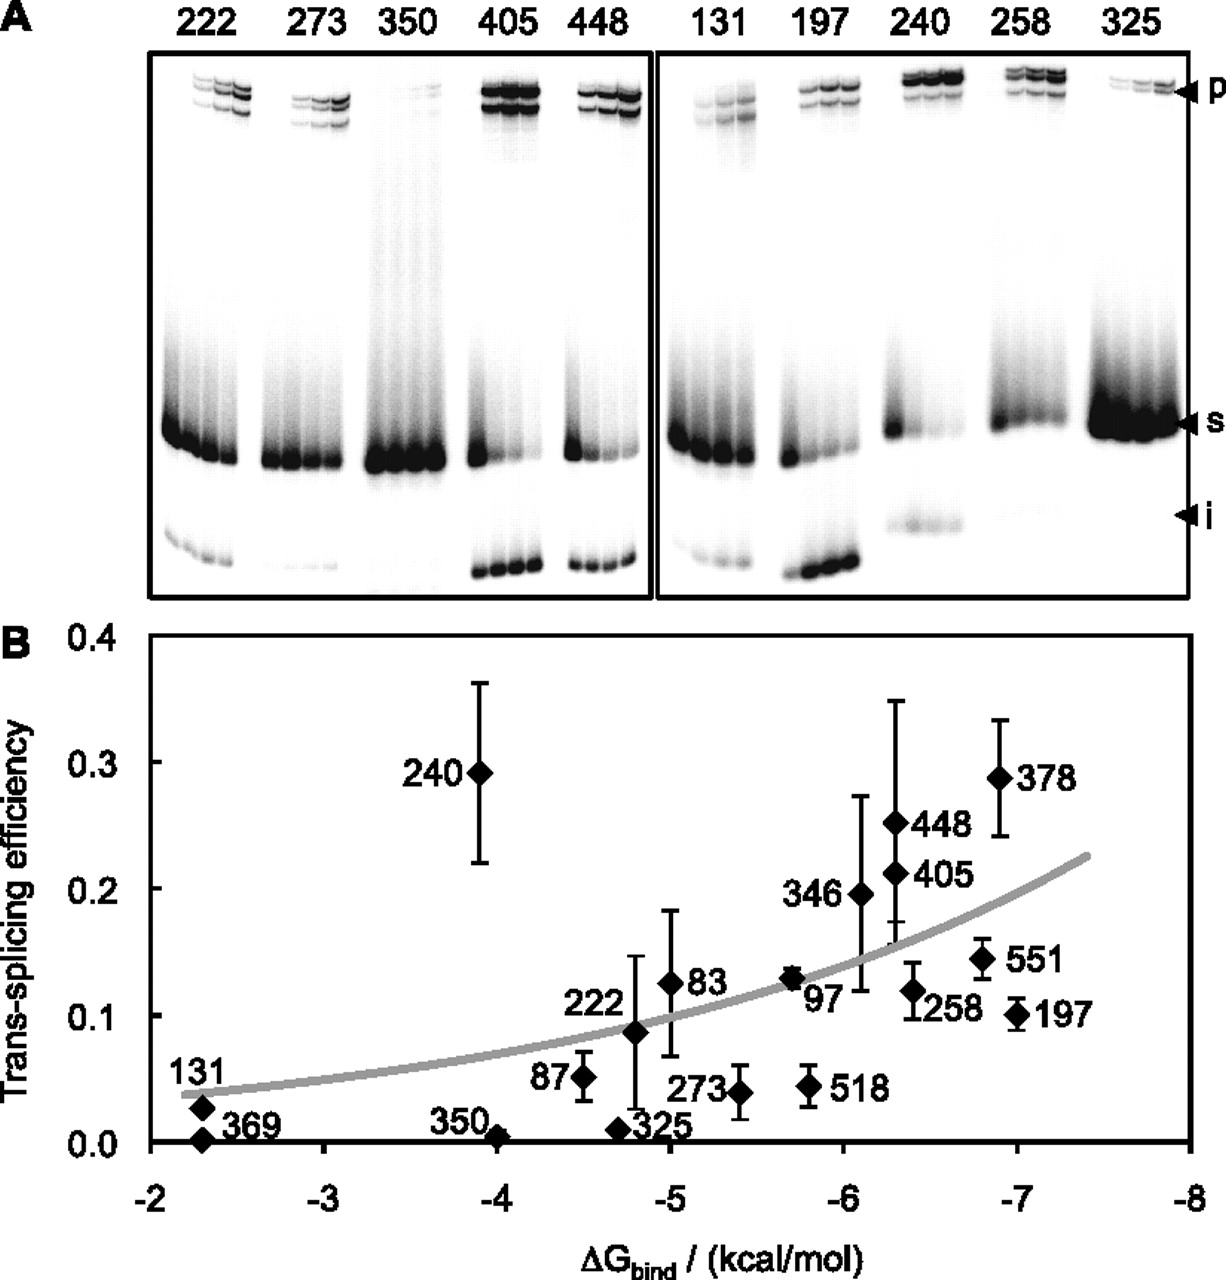
Trans-splicing efficiency with short, 13-nt substrates. (A) Representative autoradiograms of products from trans-splicing reactions. Each 13-mer substrate contains one of the 18 splice sites that were targeted on CAT mRNA. Each group of lanes shows samples taken after 1, 8, 16, and 31 min of reaction and is labeled with the position of the targeted splice site. The positions of the unreacted substrate (s; 13 nt), reaction intermediate (i; 8 nt), and trans-splicing product (p; 85 nt) are indicated. The size of the product was confirmed by comparison with an 85-nt RNA marker in separate experiments (data not shown). (B) Plot of experimental trans-splicing efficiency as a function of computed ΔGbind. The thick gray line represents a least-mean-squares exponential fit to the data points, with a coefficient of determination R2 = 0.27. Only splice site 240 (−3.9 kcal/mol; 29% reacted) results in a strong deviation from this trend. Alternatively, a linear fit (data not shown) to the same data points yields a correlation coefficient R = −0.51, with a probability p = 0.030 that the values are not correlated. Error bars are standard deviations from three independent experiments.




