


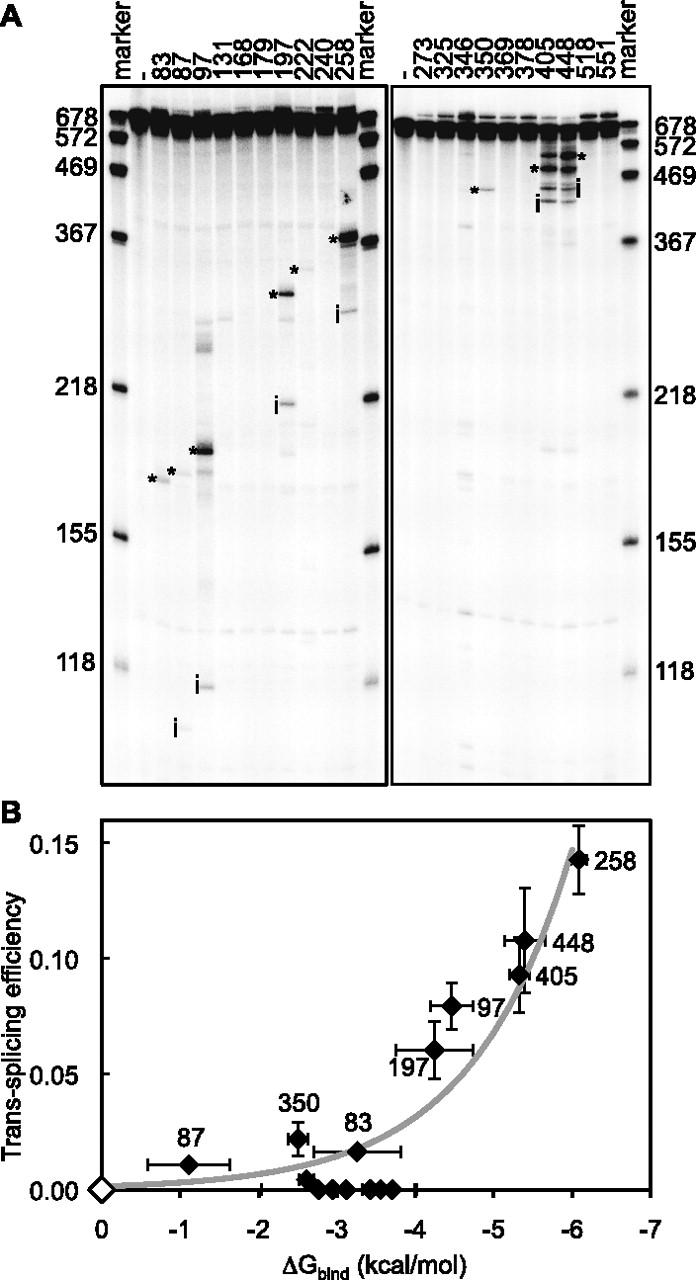
Trans-splicing efficiency measured on 18 splice sites on CAT mRNA. (A) Autoradiogram of reaction products from trans-splicing reactions with radiolabeled substrate. Lanes are labeled with the targeted splice sites, or with (−) where ribozyme was absent. RNA marker sizes in nucleotides are indicated. The unreacted substrate had a length of 678 nucleotides, whereas the length of reaction intermediates (i) and trans-splicing products (*) varied with the splice sites. Note that the ribozymes targeting splice sites 405 and 448 also spliced at each other's splice site. (B) Correlation between computed binding free energies and experimental trans-splicing efficiencies. Each diamond represents a specific splice site. Splice sites 131, 240, and 369 have ΔGbind ≥ 0 kcal/mol and are represented by a white diamond at the origin. The data points near or over the ΔGbind-axis around the value of −3 kcal/mol correspond, from left to right, to splice sites 222, 518, 273, 346, 325, 378, and 551. The thick gray line represents a least-mean-squares exponential fit, y = A exp(B x), to the data points, with a coefficient of determination R2 = 0.87. Alternatively, a linear fit (data not shown) to the same data points yields a correlation coefficient R = −0.75, with a probability p = 0.00033 that the values are not correlated. Horizontal error bars are standard deviations over three to six different window sizes (100–600 nt). Vertical error bars are standard deviations from three independent experiments.




