


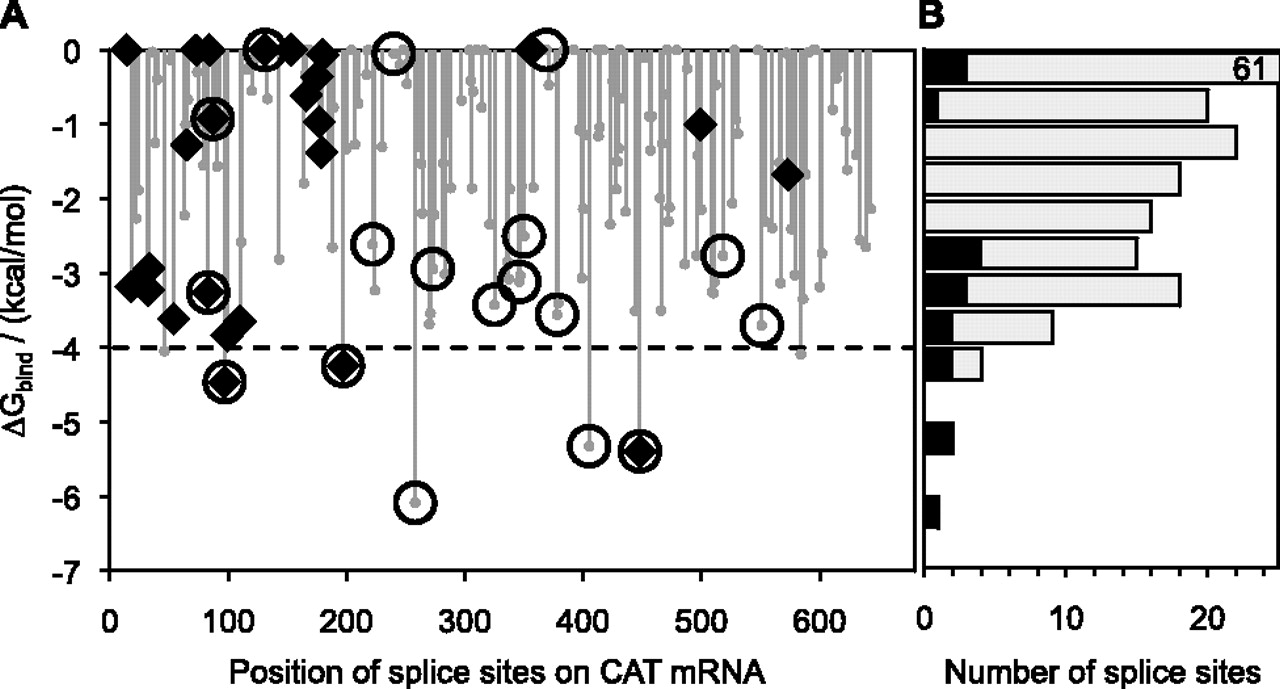
Computed values of ΔGbind for splice sites on CAT mRNA. (A) Plot of ΔGbind against splice site position relative to the adenosine (position 1) of the AUG transcription start codon. Only splice sites downstream from this codon were mapped by the trans-tagging assay in this study. Circles with or without a diamond inside indicate splice sites chosen for experimental determination of trans-splicing efficiency. Diamonds indicate splice sites found among 66 product sequences obtained by trans-tagging assay. (B) Distribution of the 186 splice sites (gray bars) of CAT mRNA over the computed values of ΔGbind. Black bars represent the 18 splice sites that were chosen for experimental testing. The topmost bar represents 61 splice sites and is shown truncated.




