


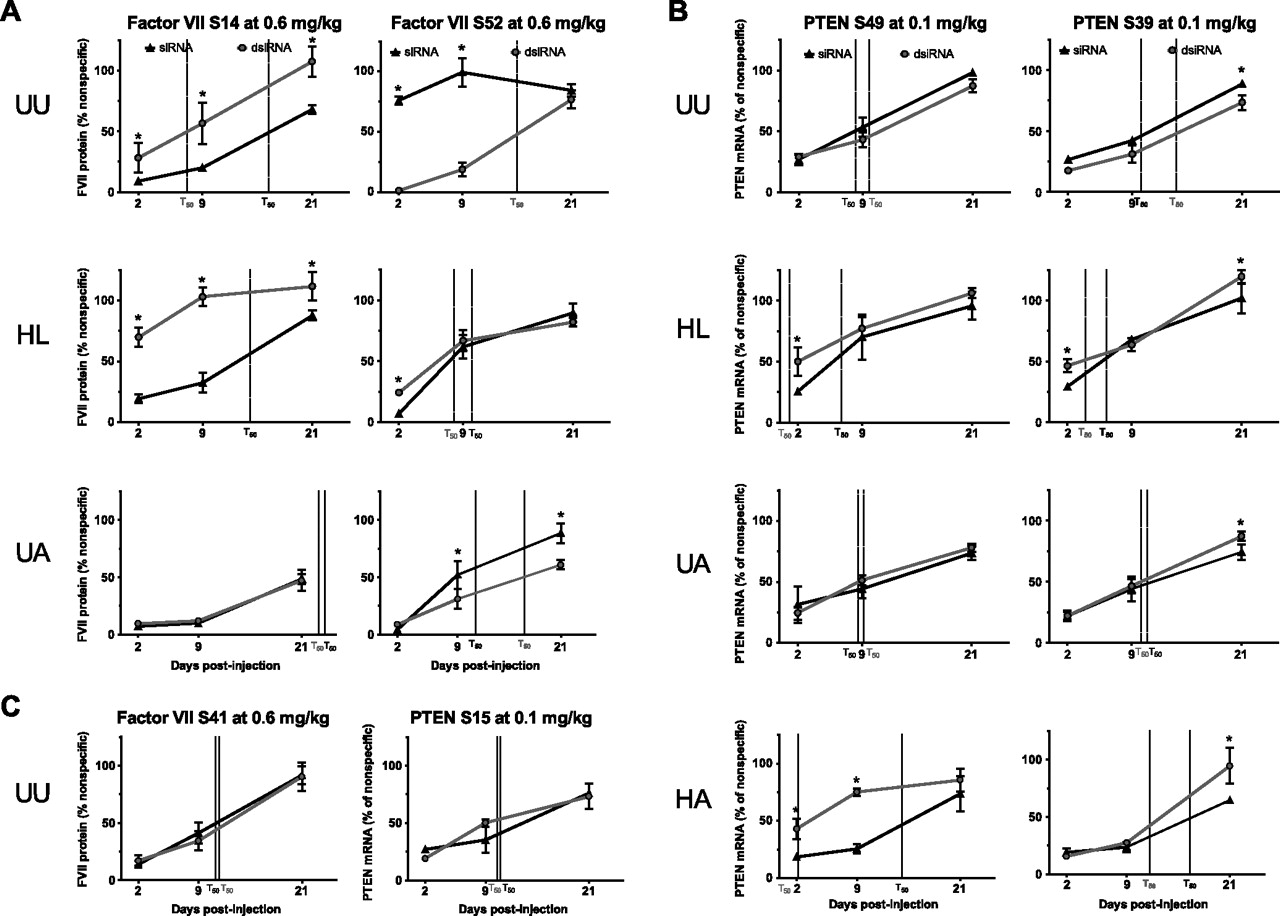
FIGURE 4.
In vivo duration. (A–C) Time-course data for 0.6 mg/kg (FVII) and 0.1 mg/kg (PTEN). Duration data were compared by two-way ANOVA (structure × day). (*) Bonferoni post hoc comparisons with p < 0.05. T50 values were determined by linear regression of duration data and defined as the time at which target suppression equaled 50%. Data points represent n = 3–5, with two technical replicates. Modifications are (UU) unmodified/unmodified, (HL) heavy/light, (HA) heavy/alternating, and (UA) unmodified/alternating.




