


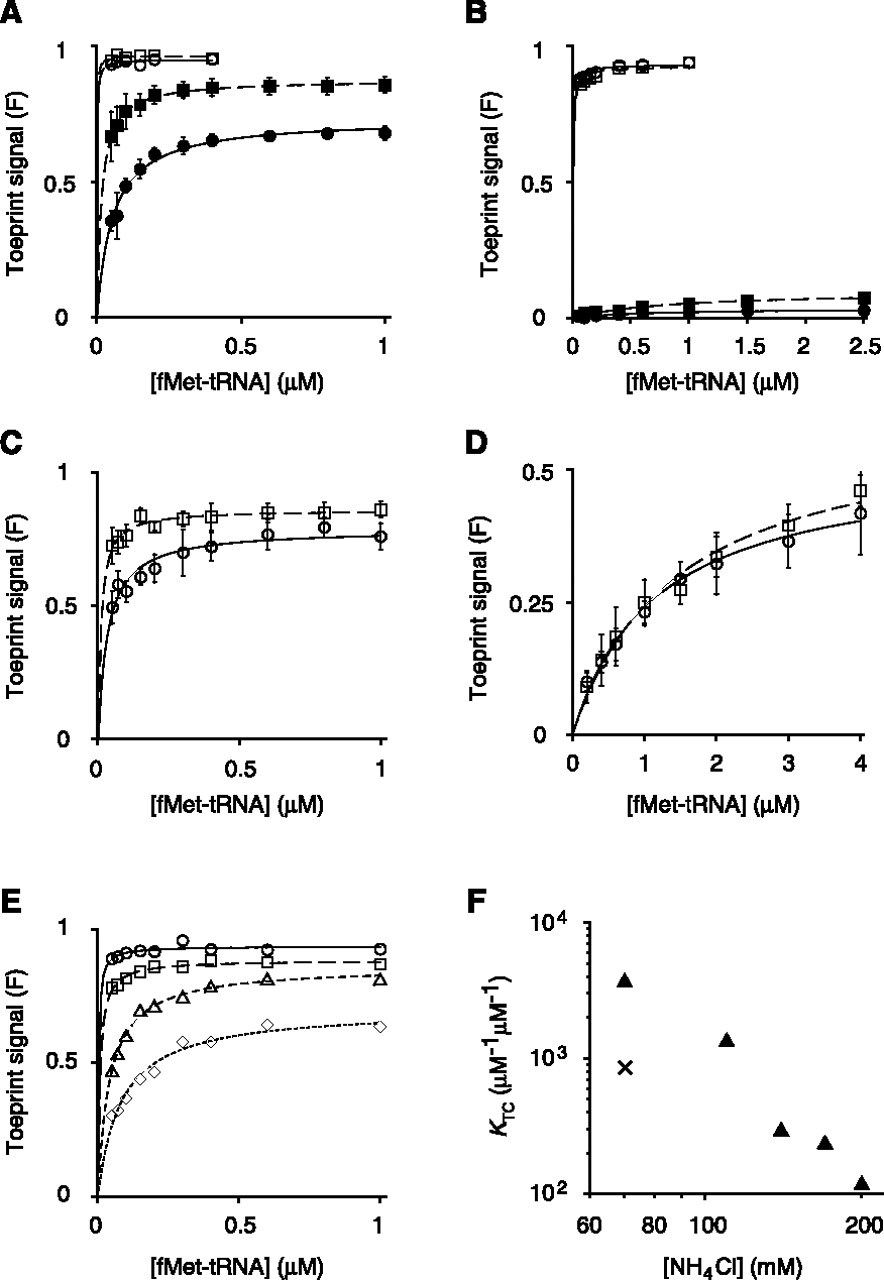
Effect of the start codon on the stability of the 30S•mRNA•fMet-tRNA ternary complex. Toeprinting was used to estimate the equilibrium constant for 30S•mRNA•fMet-tRNA ternary complex formation (KTC) under various conditions. (A–D) Wild-type (circles) or A1413C (squares) 30S subunits (0.1 μM or 1.0 μM) were incubated with fMet-tRNA (various concentrations), mRNA (0.01 μM; with pre-annealed 5′-32P-labeled primer), and GTP (100 μM), in the absence or presence of factors until equilibrium was reached, and then complexes were detected by toeprinting. The toeprint signal (F), expressed as a fraction of the total signal, is plotted as a function of total fMet-tRNA concentration. Data are fit to the equation F = Fmax[bc/(bc + 1/KTC)], where b and c correspond to the input concentrations of fMet-tRNA and 30S subunits, and Fmax represents the maximal toeprint signal. Error bars represent the SEM from three or more independent experiments. (A) Formation of 30S•AUG•fMet-tRNA in the presence of all three factors (filled symbols) or IF1 and IF2 only (open symbols). (B) Formation of 30S•AUC•fMet-tRNA in the presence of all three factors (filled symbols) or IF1 and IF2 only (open symbols). (C) Formation of 30S•AUG•fMet-tRNA in the absence of factors (at 140 mM NH4Cl). (D) Formation of 30S•AUC•fMet-tRNA in the absence of factors. (E) Formation of 30S•AUG•fMet-tRNA in the absence of factors at 70 (○), 110 (□), 170 (△), and 200 (◇) mM NH4Cl. (F) KTC values for 30S•AUG•fMet-tRNA formation (▴), estimated from curves of panels C and E, plotted as a function of NH4Cl concentration. For comparison, the × symbol represents a value 1000-fold greater than the KTC obtained for 30S•AUC•fMet-tRNA formation at 70 mM NH4Cl.




