


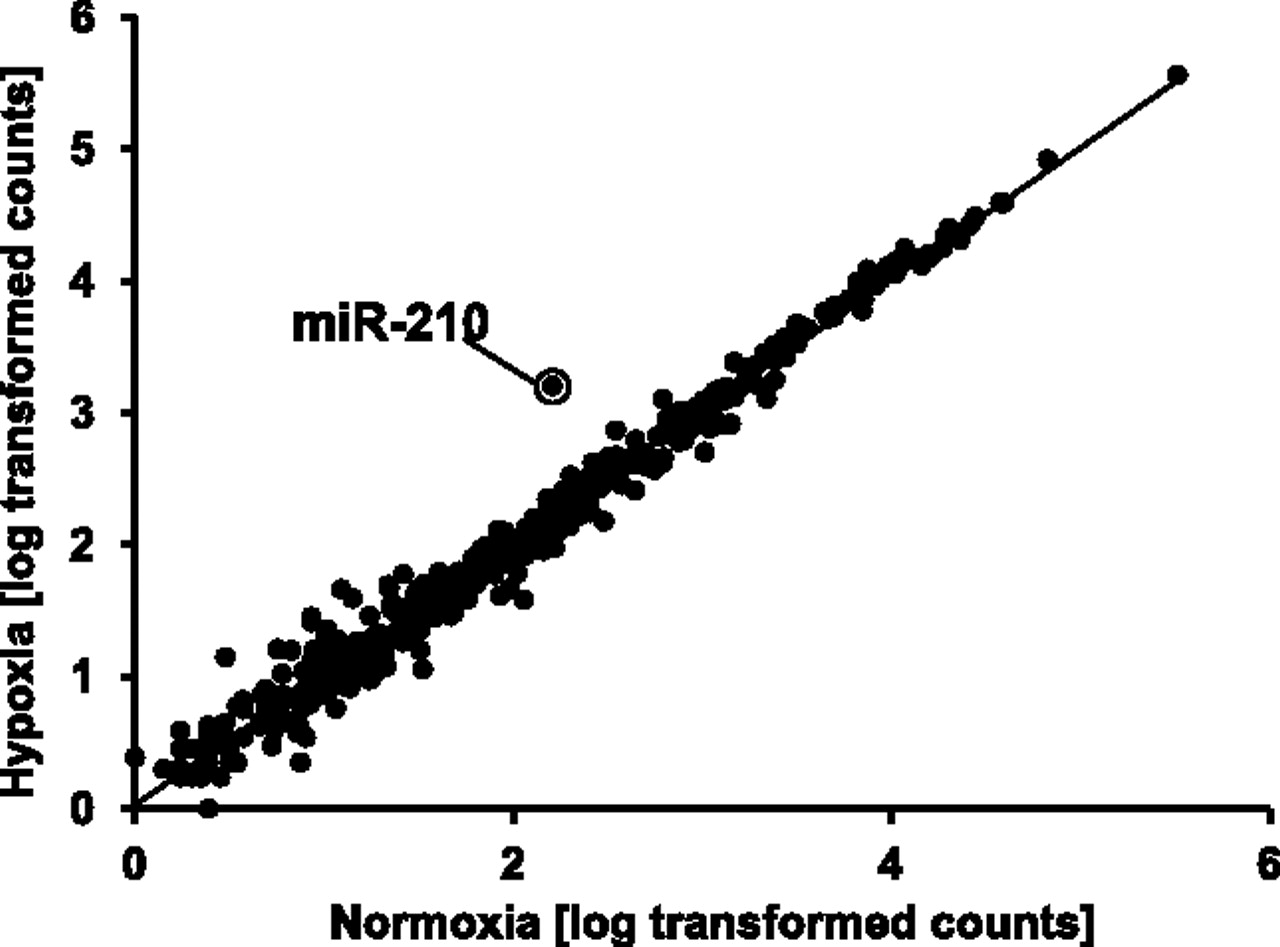
FIGURE 3.
Expression levels of annotated miRNAs in HUVECs exposed to hypoxic and normoxic conditions. Average Log10-transformed read counts obtained by deep-sequencing of normoxic versus hypoxic HUVECs. The circle highlights hypoxia-induced miR-210.




