


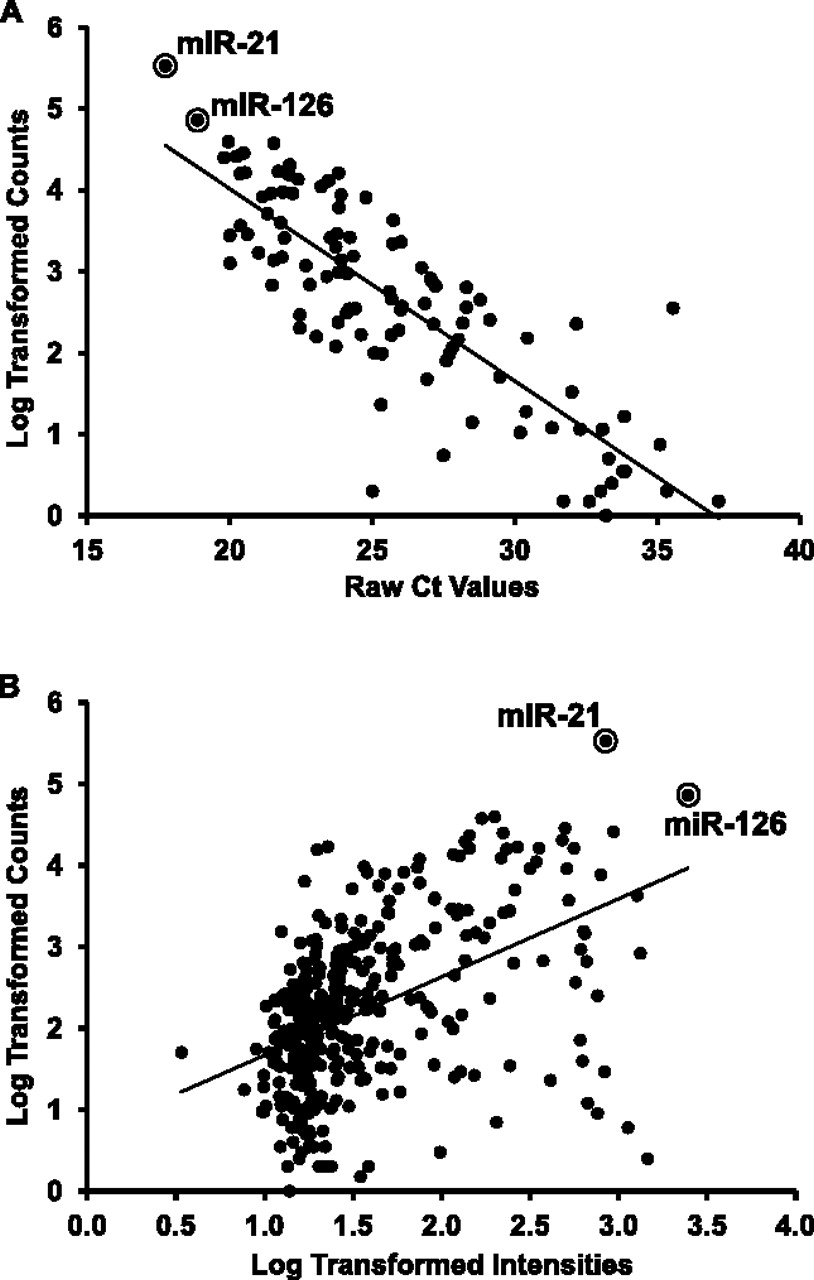
FIGURE 2.
Similar miRNA expression profiles of normoxic HUVECs obtained with independent techniques. (A) Average Ct of 114 miRNA species detected by qPCR (n = 4) were compared with the read counts, expressed in a Log10 scale, obtained by deep-sequencing (Pearson's r = −0.86, P < 0.0001). The circles highlight miR-21 and miR-126, the two most abundant miRNAs among all identified species in HUVECs. (B) Average Log10-transformed Hy3 intensities of 269 miRNA probes of miRCURY LNAmicroRNA Arrays version 11.0, Exiqon (n = 7), were compared to the Log10-transformed read counts obtained by deep-sequencing (Spearman r = 0.64, P < 0.0001). The circles highlight miR-21 and miR-126.




