


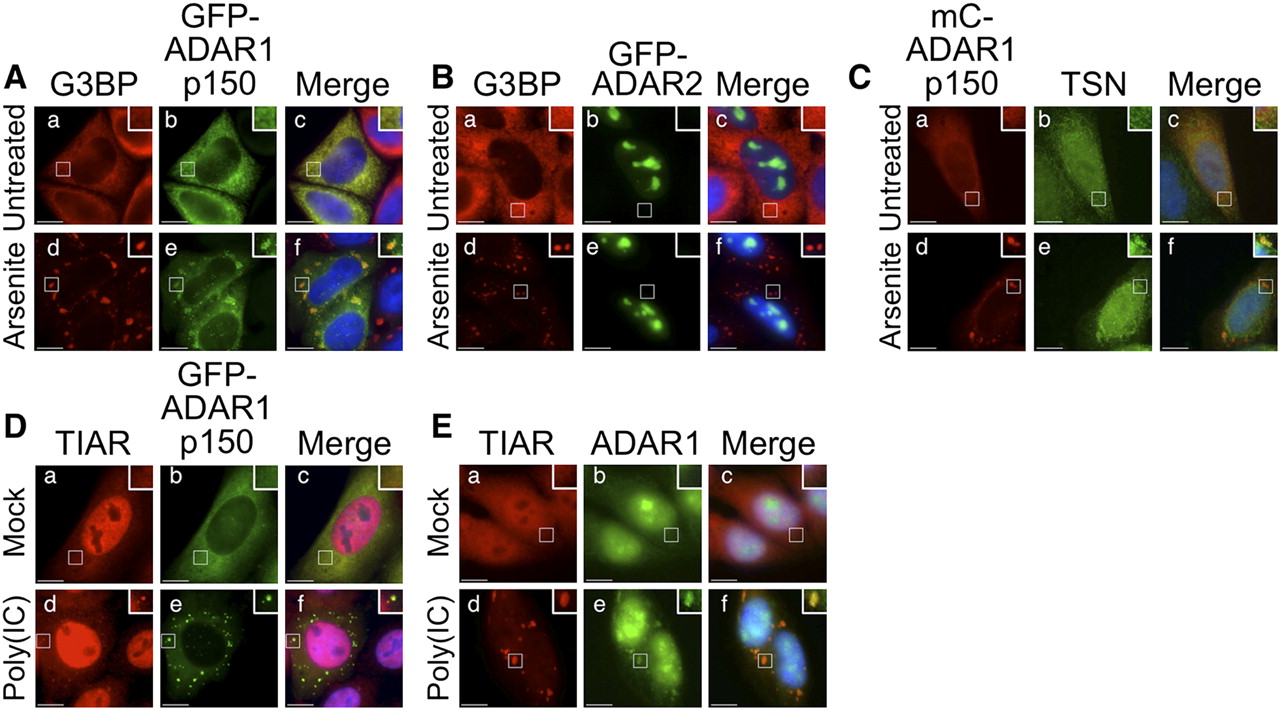
ADAR1 localizes to stress granules. (A) HeLa cells were transiently transfected with an expression vector for GFP–ADAR1 p150. After 24 h cells were cultured in the absence (a–c) or presence of arsenite (d–f) before processing for visualization of G3BP (red; a,d) or GFP–ADAR1 p150 (green; b,e). DAPI staining is blue (Merge; c,f). (B) HeLa cells were transiently transfected with an expression vector for GFP–ADAR2. After 24 h the cells were cultured in the absence (a–c) or presence of arsenite (d–f) before processing for visualization of G3BP (red; a,d) and GFP–ADAR2 (green; b,e). DAPI staining is blue (Merge; c,f). (C) HeLa cells were transiently transfected with an expression vector for mC–ADAR1 p150. After 24 h the cells were cultured in the absence (a–c) or presence of arsenite (d–f) before processing for visualization of mC–ADAR1 p150 (red; a,d) and TSN (green; b,e). DAPI staining is blue (Merge; c,f). (D) HeLa cells were transiently transfected with an expression vector for GFP–ADAR1 p150. After 24 h the cells were transfected with (d–f) or without (a–c) poly(IC). After 7 h, cells were fixed and immunofluorescence microscopy was used to visualize TIAR (red; a,d) and GFP–ADAR1 p150 (green; b,e). DAPI staining is blue (Merge; c,f). (E) HeLa cells were transfected with (d–f) or without (a–c) poly(IC). After 7 h, cells were fixed and immunofluorescence microscopy was used to visualize TIAR (red; a,d) and endogenous ADAR1 (green; b,e). DAPI staining is blue (Merge; c,f). Bar, 10 μm.




