


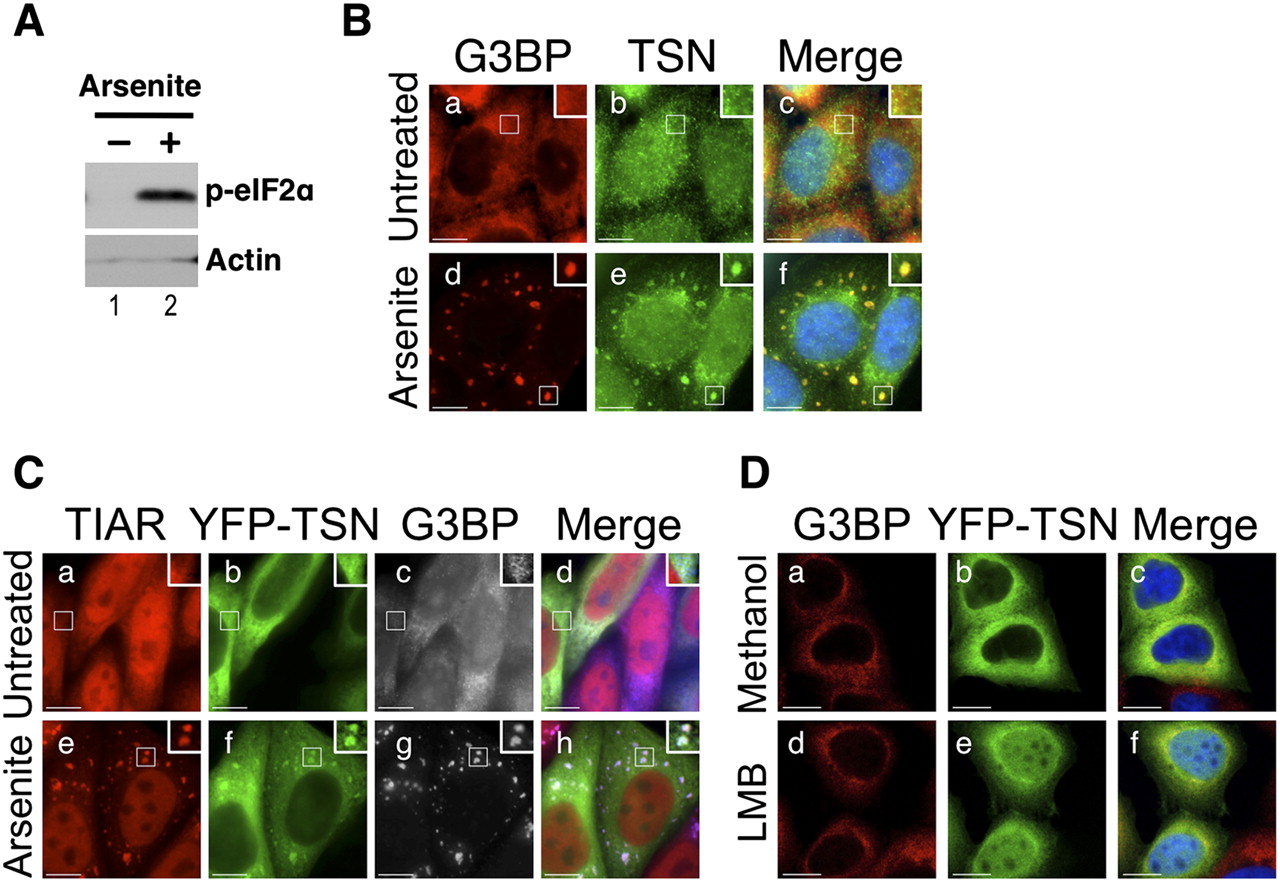
Tudor-SN localizes to stress granules. (A) Lysates were prepared from HeLa cells treated ±arsenite, and immunoblotting was used to analyze phosphorylation of eIF2α (p-eIF2α). Actin was a loading control. (B) HeLa cells were cultured in the absence (a–c) or presence of arsenite (d–f), then fixed and processed for visualization of G3BP (red; a,d) and Tudor-SN (TSN) (green; b,e) using fluorescence microscopy. DAPI staining is blue (Merge; c,f). (C) HeLa cells were transiently transfected with an expression vector for YFP–TSN. After 24 h the cells were cultured in the absence (a–d) or presence of arsenite (e–h) before processing for visualization of TIAR (red; a,e), YFP–TSN (green; b,f), and G3BP (blue [shown as gray]; c,g) using fluorescence microscopy. Merged images are shown for untreated and arsenite-treated cells (Merge; d,h). (D) HeLa cells were transiently transfected with an expression vector for YFP–TSN. After 24 h the cells were cultured in the absence (Methanol; a–c) or presence of leptomycin B (LMB; d–f) before processing for visualization of G3BP (red; a,d) and YFP–TSN (green; b,e) using confocal microscopy. DAPI staining is blue (Merge; c,f). Bar, 10 μm.




