


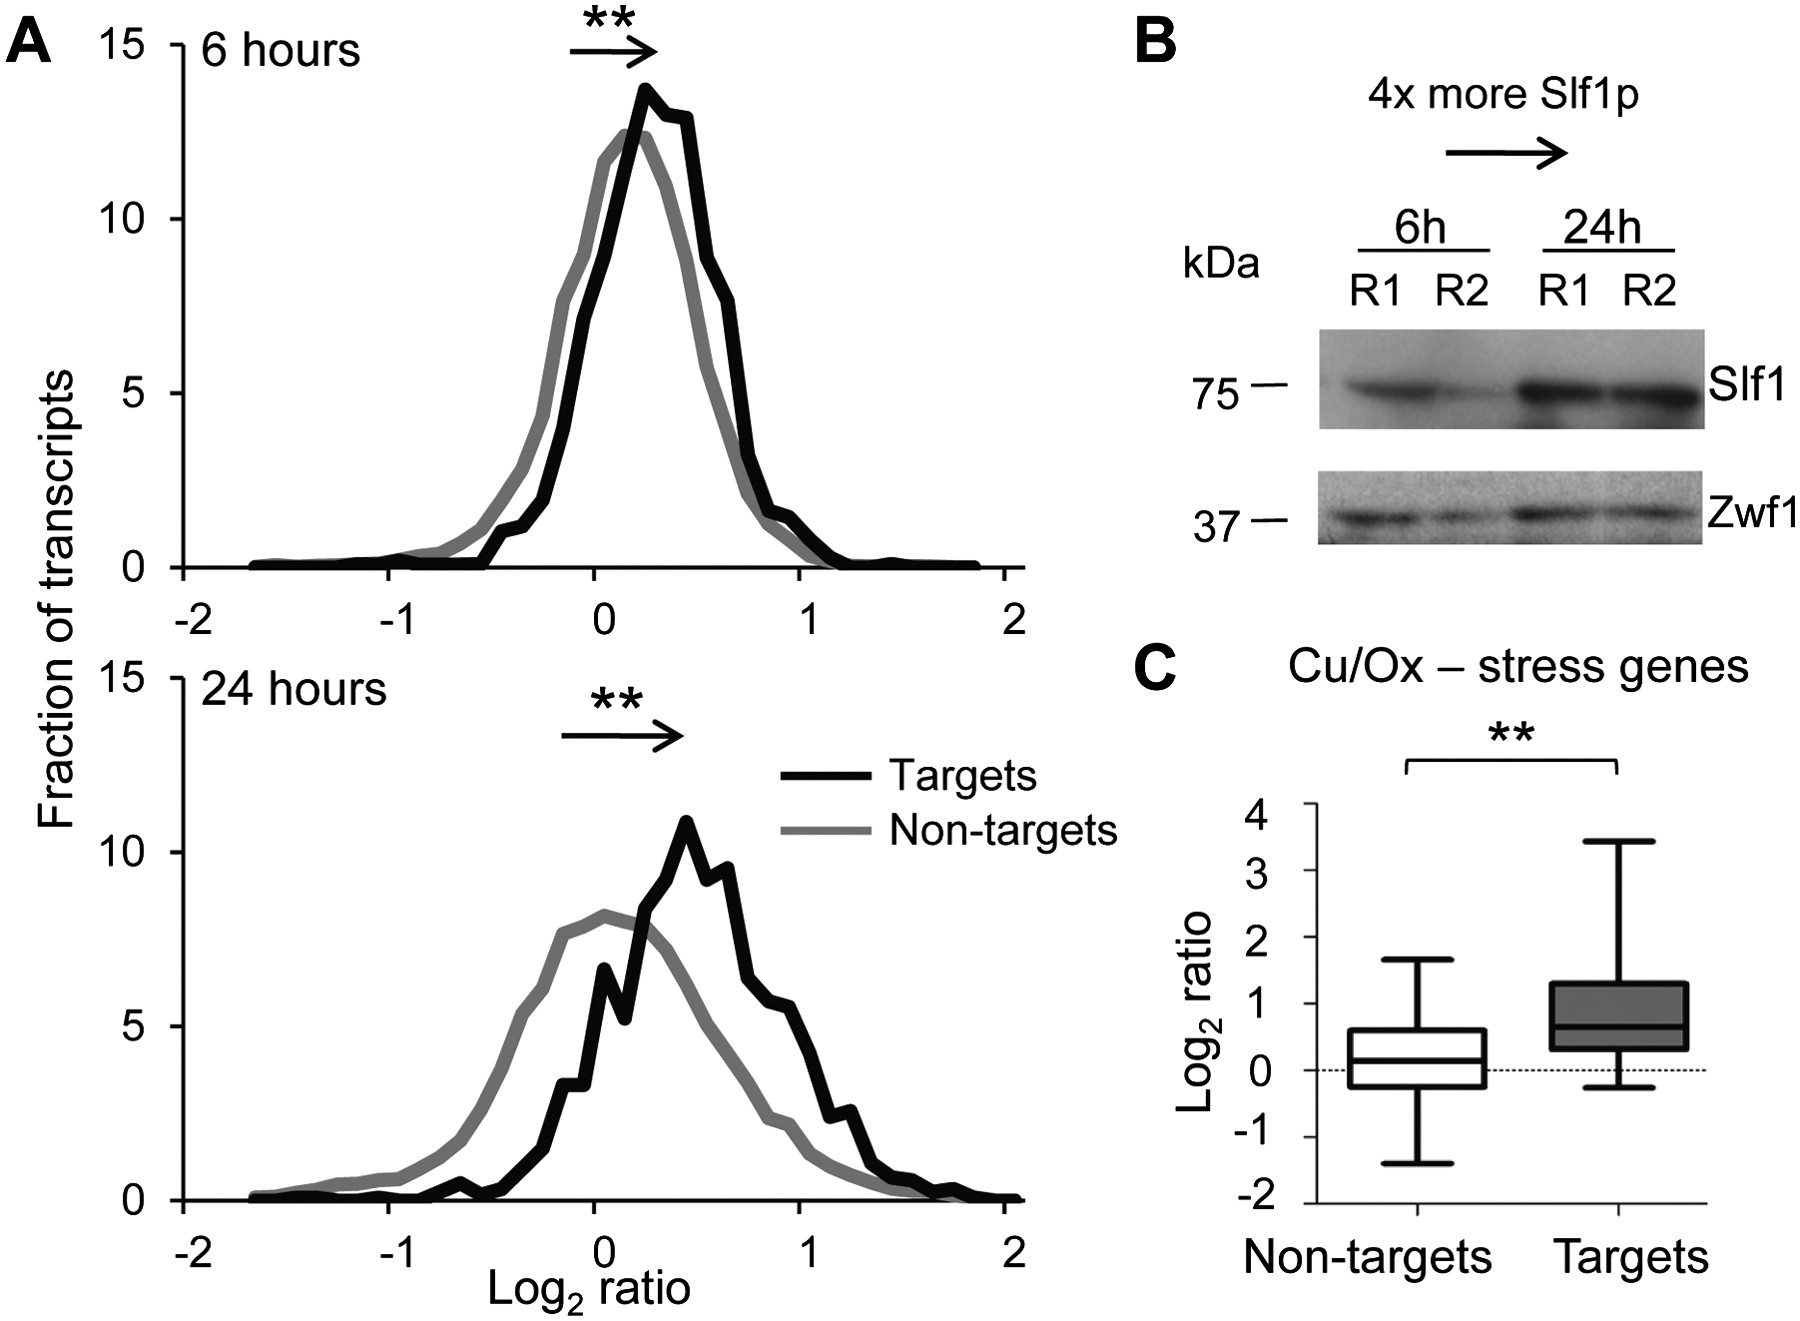
Overexpression of SLF1 positively affects Slf1p mRNA target levels. (A) Histogram depicting the fraction (y-axis) of average Cy5/Cy3 fluorescence ratios from duplicate microarray experiments comparing RNA levels in SLF1 overexpressing cells with control cells (empty vector) after 6 h (upper scheme) and 24 h (lower scheme). The bin size for fractions (y-axis) is 0.1 log2 ratios (x-axis). The black line depicts the distribution of Slf1p RNA targets defined from RIP-Chip experiments. The gray line represents nontargets. **P-value < 0.001, Mann-Whitney test. (B) Immunoblot analysis with peroxidase-anti-peroxidase soluble complex (PAP) to detect tagged Slf1p and monitor the expression after 6 and 24 h of induction. Two biological replicates are shown with R1 and R2. Zwf1p is a loading control. (C) Box plots depicting relative differences in mRNA levels of Slf1p nontargets (white) and targets (gray) among copper and oxidative stress–related genes after 24 h of SLF1 overexpression. Averaged relative changes of mRNA expression levels are indicated as log2 ratios. **P-value = 0.0013 (Mann-Whitney test).




