


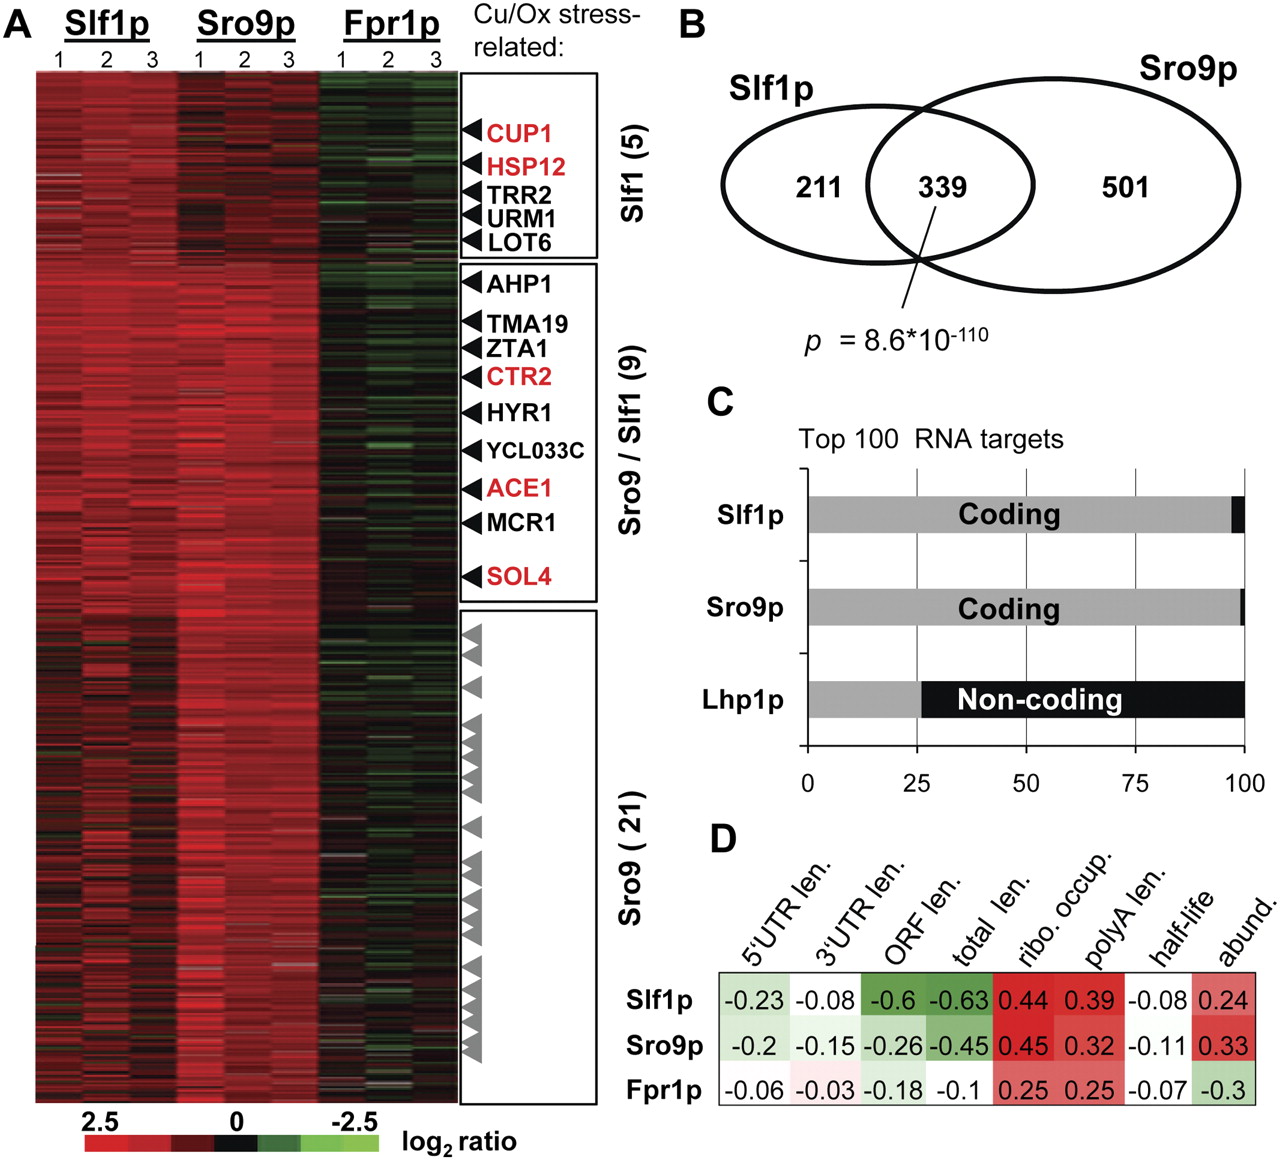
Slf1p and Sro9p bind to overlapping sets of mRNAs. (A) Heat map depicting the log2 ratios for RNA enrichment in three biological RIP replicates with Slf1p, Sro9p, and the negative control Fpr1p (columns). Rows are features representing transcripts and were grouped into Slf1-specific (211 transcripts), Sro9 and Slf1 associated transcripts (339), and Sro9-specific targets (501 transcripts). Each target group is ranked according to increasing P-values. The color code indicates the degree of enrichment (green–red color scale). mRNAs related to copper-homeostasis (red) and/or response to oxidative stress (black) are indicated to the right (for complete list, see Supplemental Table 2). (B) Venn-diagram depicting the overlap between Slf1p and Sro9p mRNA targets. The P-value was calculated with the Fisher's exact test. (C) Bar chart showing the number of coding and noncoding RNA targets of Slf1p, Sro9p, and Lhp1p (Inada and Guthrie 2004) among the top 100 targets (according to log2 enrichment). (D) Pearson correlation coefficients between RIP-enrichments and selected mRNA characteristics. Abbreviations are as follows: Len., the length of the 5′ UTR, 3′ UTR, open reading frame (ORF) and the poly(A) tail (polyA); ribo., ribosome occupancy; half-life, mRNA half-life; and abund., mRNA abundance.




