


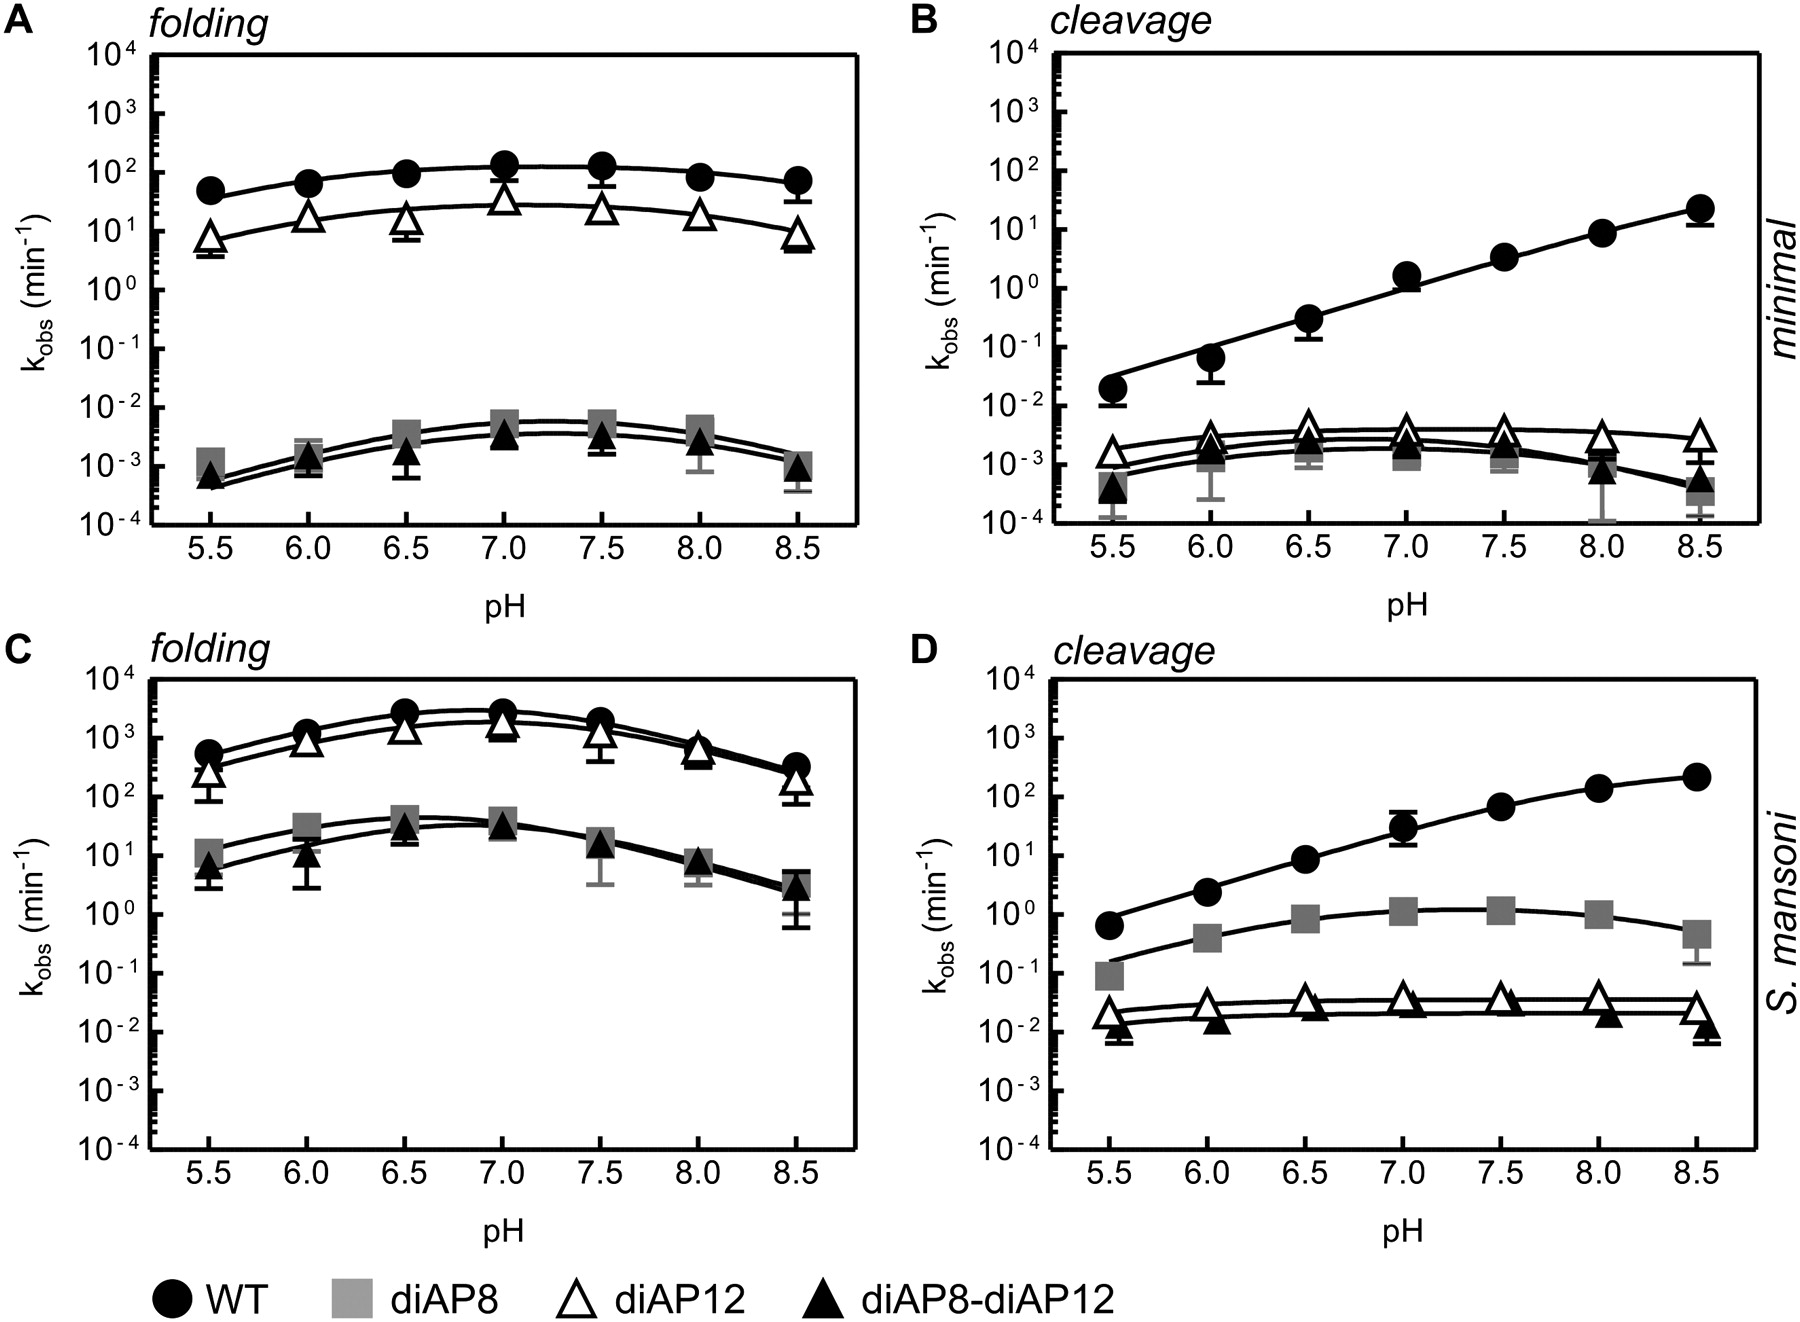
Comparison of pH-dependent core folding and cleavage of unmodified G8 (closed, black circle), diAP8 (closed, gray squares), diAP12 (open, black triangle), and double diAP8-diAP12 (black triangle) in the background of both minimal (A,B) and natural (C,D) S. mansoni hammerhead ribozyme. The pH-dependent core folding (pyC7) was performed as described in Figure 3. Folding of the analyzed minimal ribozyme and variants yielded an almost-flat pH profile, where the differences between high, moderate, and low pH did not exceed twofold, and fit resulted in two apparent pKas of folding that are rather approximations of ∼5.5 (±1.7) and 8.5 (±0.9) for G8-G12; ∼6.0 (±1.5) and 8.0 (±0.9) for diAP12; 6.2 (±1.4) and 8.0 (±0.9) for diAP8; and ∼6.2 (±1.3) and 8.0 (±1.4) for diAP8-diAP12. The same experiments performed in the background of the natural ribozyme yielded pKas of 6.3 (±0.2) and 7.4 (±0.1) for G8-G12; 6.5 (±0.4) and 7.4 (±0.5) for diAP12; 6.1 (± 0.6) and 6.9 (±0.3) for diAP8; 6.2 (±0.3) and 6.9 (±0.5) for diAP8-diAP12. The pH-dependent cleavage reactions of minimal (B) and natural (D) ribozymes were performed as described in Figure 4. The pH-dependent cleavage for unmodified minimal ribozyme is log linear with pKa higher than 9. Cleavage of the minimal ribozyme single and double G8-G12 variants yielded bell-shaped pH profiles and resulted in two apparent pKas: 5.7 (±0.4) and 8.5 (±0.3) for diAP12; 6.1 (±0.3) and 7.7 (±0.3) for diAP8; 5.9 (±0.2) and 7.7 (±0.6) for diAP8-diAP12. The same pH profiles for natural ribozyme yielded a log-linear activity increase for unmodified ribozyme with a slight leveling off at pH 8.5, yielding an apparent pKa of 8.4 (±0.2). The single diAP8 mutation showed a bell-shaped profile of cleavage, which resulted in apparent pKas of 6.7 (±0.4) and 8.1 (±0.3). Both single diAP12 and double diAP8-diAP12 variants showed too small differences in cleavage across the analyzed pH (twofold) to obtain reliable fit; consequently, the pKas were assigned to be <5.5 and >8.5. For clarity of the graph, the cleavage values for diAP8-diAP12 were incremented by 0.05 pH unit.




