


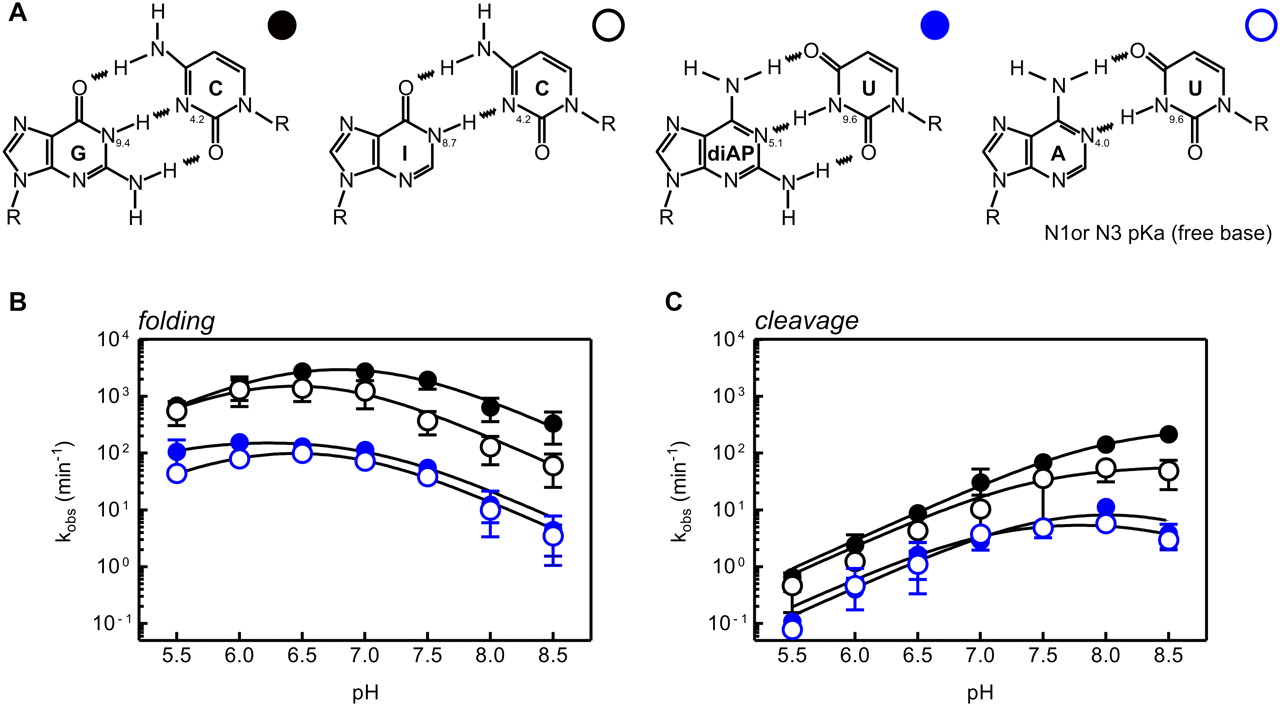
Comparison of pH dependence of cleavage and folding for the S. mansoni hammerhead ribozyme and its G8-C3 base pair Watson-Crick analogs. (A) Structure of the G8-C3 Watson-Crick base pair (black circle) and analog pairs of I8-C3 (open, black circles), diAP8-U3 (blue circles), and A8-U3 (open, blue circles). The respective pKa values of N1 of purines and N3 of pyrimidines are highlighted. (B) pH-dependent folding as monitored by fluorescence change of core pyC7 of G8-C3 and analog base pair variants. The folding data were acquired, fitted, and plotted as described for G8-C3 folding in Figure 3 and Materials and Methods. Each of the analyzed variants yielded two apparent pKas of folding: 6.1 (±0.3) and 6.8 (±0.2) for I8-C3; 5.5 (±0.1) and 7.1 (±0.2) for diAP8-U3; 5.9 (±0.1) and 6.9 (±0.1) for A8-U3 as compared with 6.3 (±0.2) and 7.4 (±0.1) for G8-C3. (C) pH-dependent cleavage assays were performed under single turnover conditions with the same buffer, salt, and Mg2+ concentrations as described for folding experiments in Figure 3. The resulting apparent rate constants for cleavage were plotted as a function of pH and fitted to the Henderson–Hasselbalch equation yielding one apparent pKa value of 8.4 (±0.2) for G8-C3 and 8.0 (±0.2) for I8-C3. For diAP8-U3 and A8-U3, the pH dependence of cleavage resembles a bell-shaped profile, and curve fitting yielded two pKas. The best fit was obtained when the second pKa was constrained to >8.5 and then the fit yielded the upright pKa of 7.5 (±0.3) for diAP8-U3, 7.0 (±0.2) for A8-U3. For the clarity of the graphs, we have displayed only every 0.5 pH unit datum. For the very low and high pH conditions, the cleavage and folding were performed in smaller increments than displayed. (Instead of 0.5 pH unit, 0.2 increments were tested, starting at pH 5 and ending at pH 9, respectively. pH 9 and 5 were not included in the fit.) The values are summarized in Tables 1–3.




