


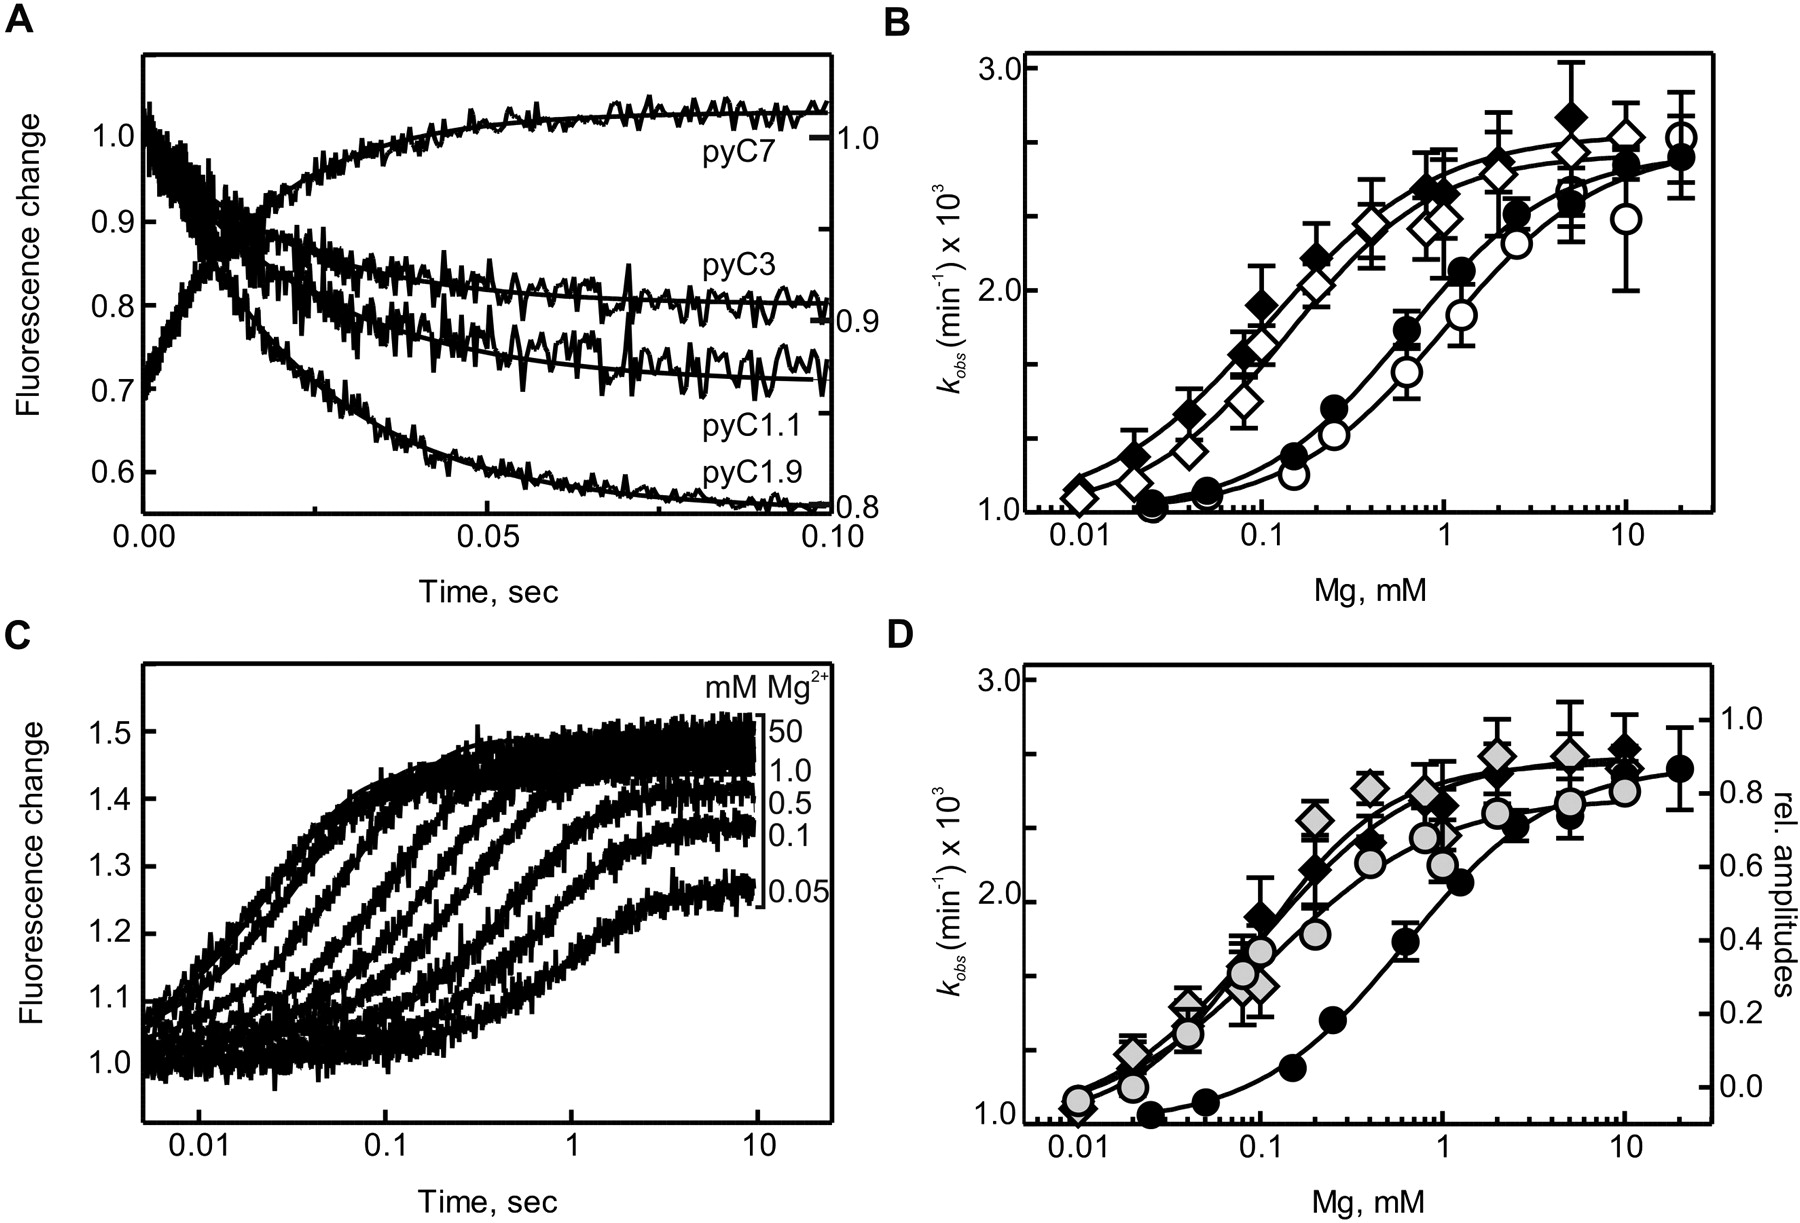
Folding of S. mansoni hammerhead ribozyme as observed by pyC fluorescence changes in stopped-flow fluorimeter. (A) Time courses of hammerhead ribozyme–substrate (noncleavable) complex folding upon exposure to 10 mM Mg2+, in the presence of 50 mM Tris-HCl and 100 mM NaCl (pH 7.0) at 25°C, as reported at positions in the Loop II (pyC1.9), Stem I (pyC1.1), and core region (pyC3 and pyC7). The displayed curves are averages of at least four measurements. The smooth lines represent the fit (see Materials and Methods). (B) kobs (per minute) for folding plotted as a function of Mg2+ concentration. The data have been fitted to a two-state binding model yielding a Hill coefficient equal ∼1 for all analyzed variants and an apparent dissociation constant [Mg2+]1/2: 0.12 (±0.01) mM for pyC1.9 (black diamonds); 0.14 (±0.03) mM for pyC1.1 (open diamonds); 0.8 (±0.2) mM for pyC3 (open circles); and 1.0 (±0.03) mM for pyC7 (black circles). (C) An example of time courses of folding monitored in the core of the ribozyme at position pyC7 with increasing Mg2+ concentration. Please note earlier amplitude than observed rate constant saturation with increasing Mg2+ concentration. (D) Comparison of Mg2+ dependence of the apparent kobs for pyC1.9 and pyC7 (black diamonds and circles) with Mg2+ dependence of their relative fluorescence amplitudes (gray diamonds and circles, respectively). (Left y-axis) kobs; (right y-axis) normalized relative amplitudes. The fluorescence amplitudes were normalized so that the maximal fluorescence amplitude observed in each experiment was valued at 1. The apparent dissociation constant established from changing fluorescence amplitudes was [Mg2+]1/2: 0.09 (±0.01) mM for pyC1.9 (gray diamonds) and 0.11 (±0.03) mM for pyC7 (gray circles).




