


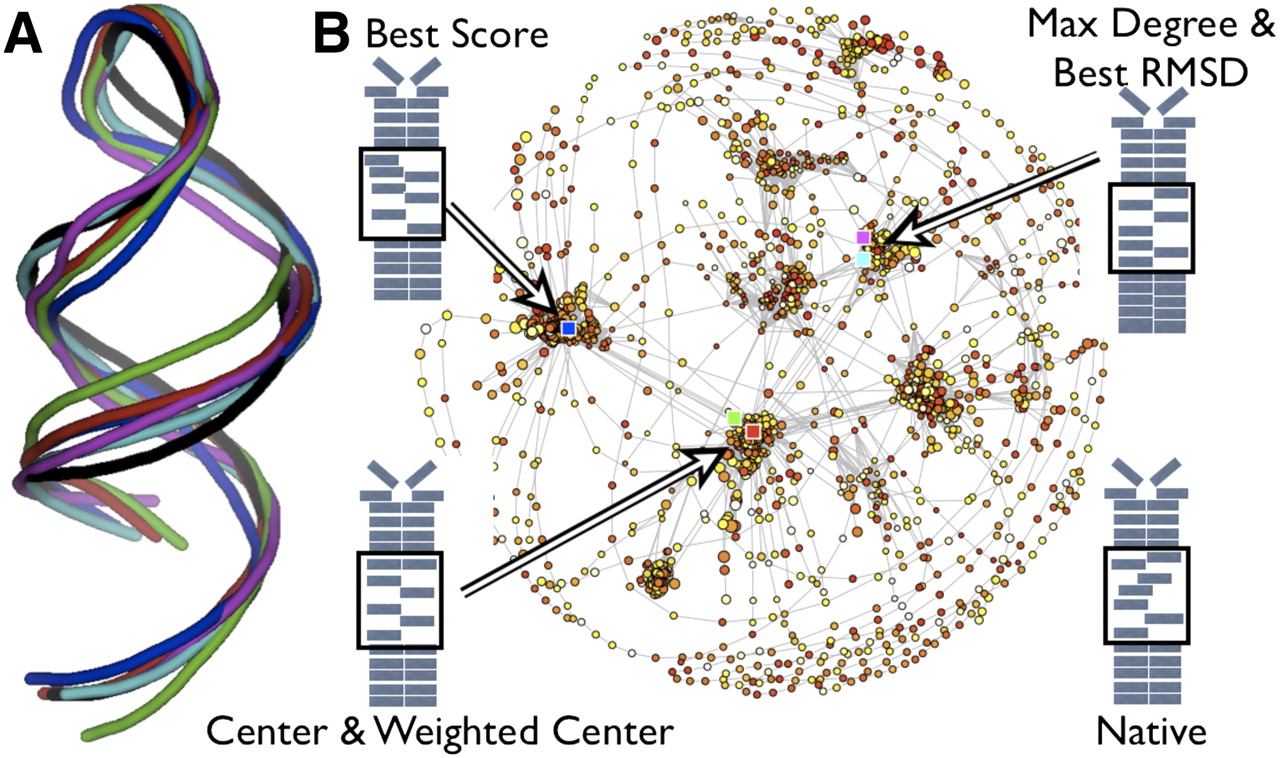
Predicted RNA tertiary structures and graph representation of conformational space. (A) Ribbon diagram through the C4′ backbone atoms of predicted conformations for the 29-nt anti-NF-κB p50 RNA aptamer based on the secondary structure cluster with the best overall score (blue), Graph Center (red), Weighted Center (green), Maximal Degree (purple), and RMSD (cyan) compared to the native conformation identified experimentally by NMR (black) (Reiter et al. 2008). (B) Graph representation of conformational space with simulation paths (gray lines) and conformations colored by low (red) to high (yellow) score with radius proportional to the RMSD from the native structure. Colored squares are locations of backbone conformations shown in A with the same coloring scheme. Secondary structure diagrams show the relative base positions with arrows pointing to each region of the space, with the native structure illustrated on the bottom right.




