


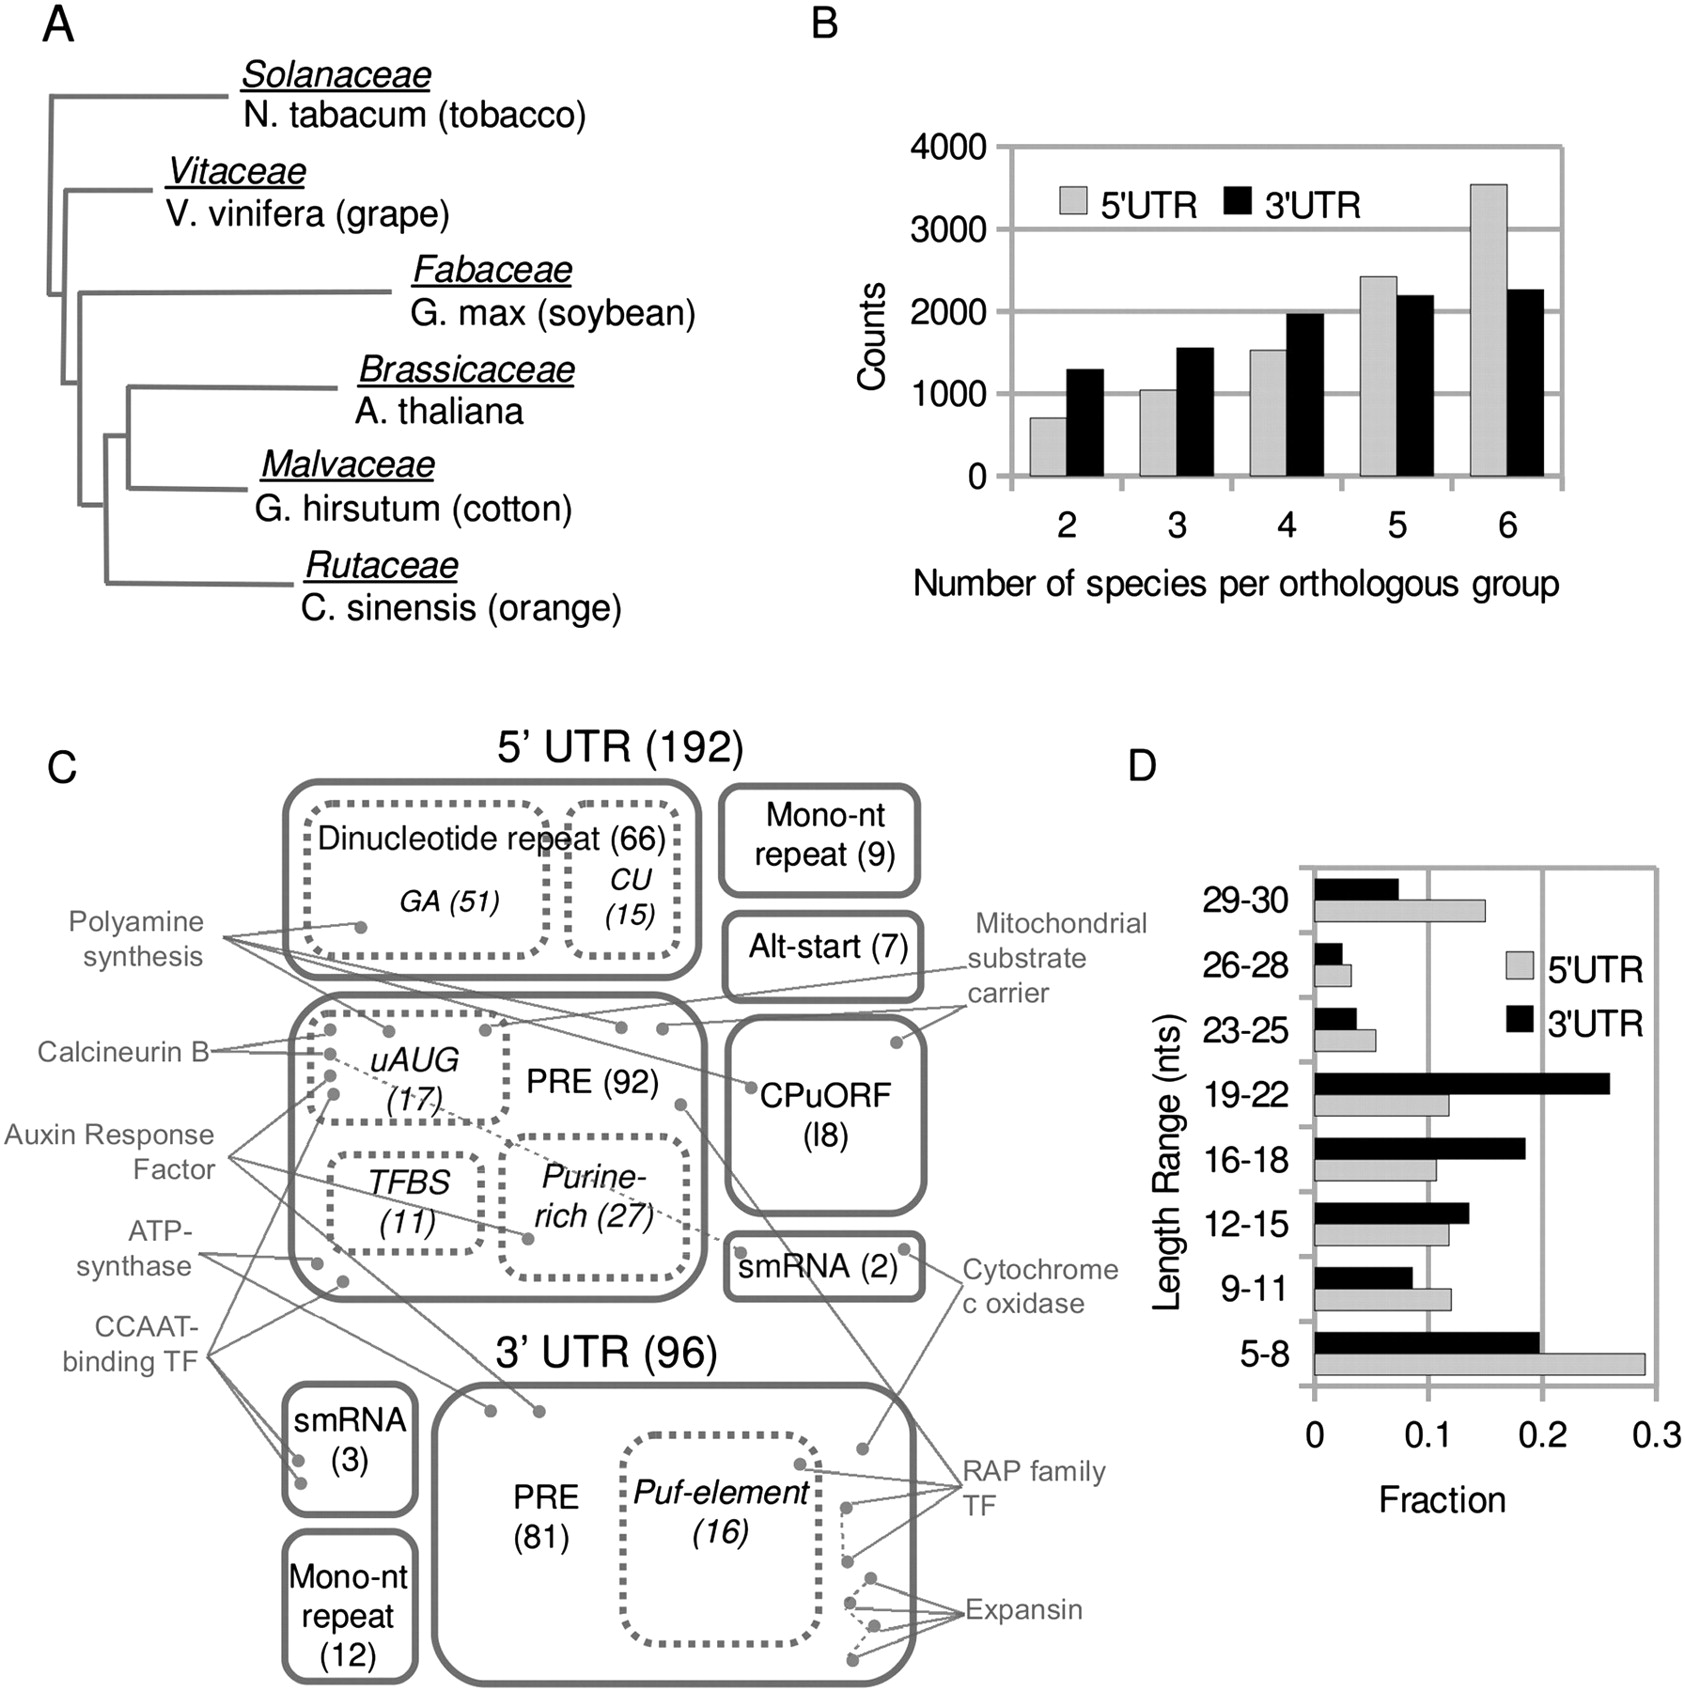
The landscape of post-transcriptional regulatory sequences that are conserved in flowering plants. (A) Tree representing descent and relative divergence of the species in this analysis. Modified from Bausher et al. (2006) and based on chloroplast genomes. The family name is given above its representative species. (B) Distributions for the number of species per orthologous group in 5′ and 3′ UTR comparisons. (C) A categorical map of conserved motif annotations. Box size roughly indicates the proportion of annotations that we assigned to each category. Exact values are given in parentheses. A box with dashed lines indicates that the category is a subset of the larger, solid-lined box. A dot indicates a single orthologous group. Only a small selection of orthologous groups are shown, and these are placed in the annotation box associated with their conserved motif. Gray labels describe the larger gene families to which these specific orthologous groups belong. A dashed line between orthologous groups indicates that the motifs are similiar (RAP family, Expansin). A dashed line added to Calcineurin B indicates multiple annotations of its conserved motif. (TFBS) transcription factor binding site. (D) Histograms, calculated independently, of PRE lengths in both UTRs. Related to Supplemental Files 2, 3, and 4.




