


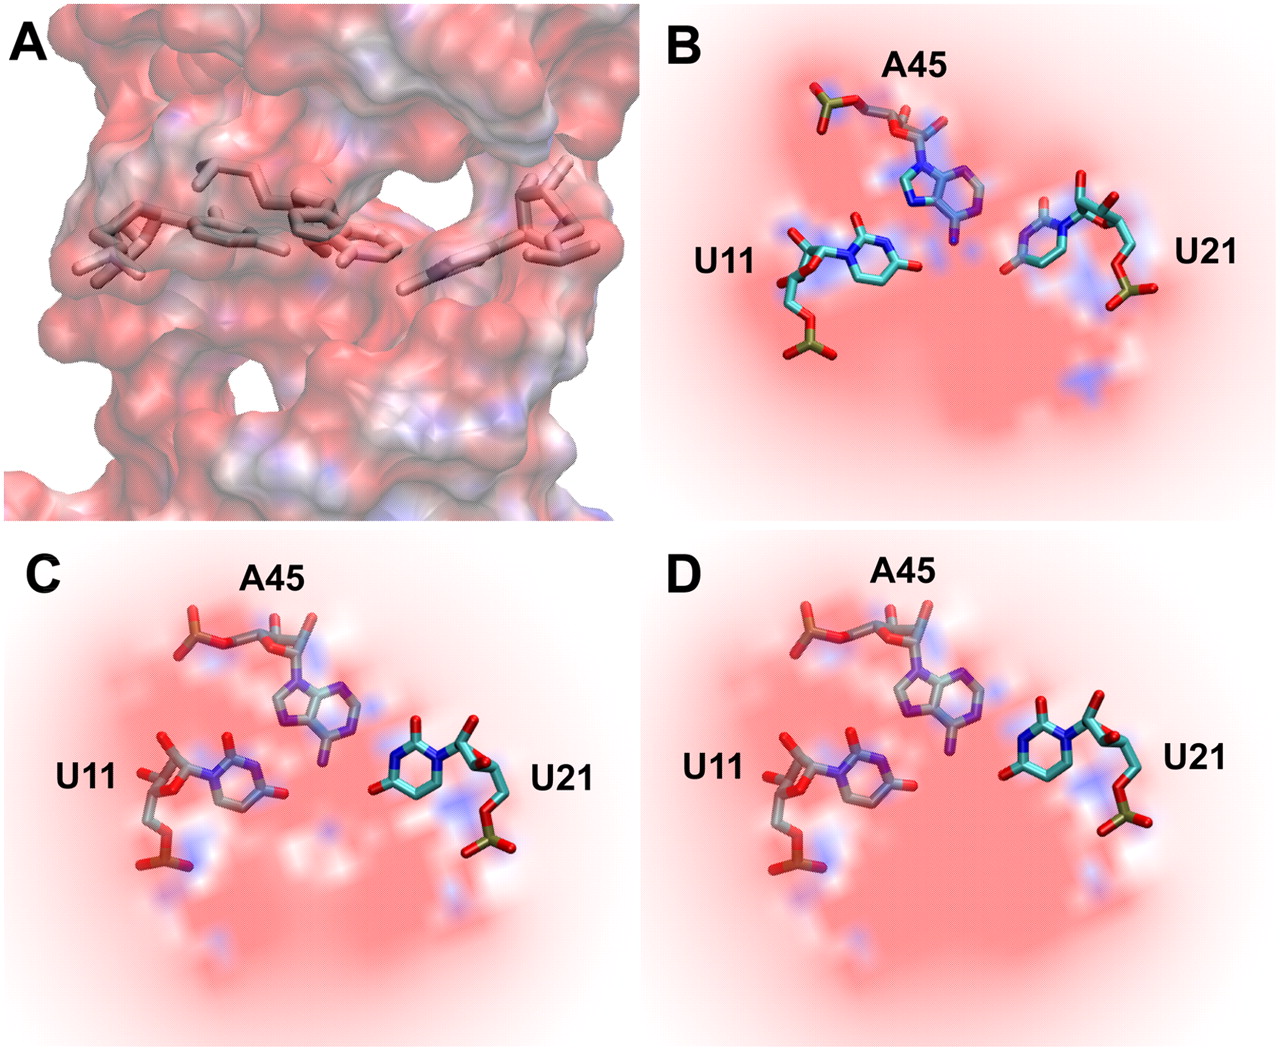
Electrostatic basis for the binding specificity of SAM. Electrostatic potential map of the binding pocket of the SAM-II riboswitch. Shown are the cross-sectional (A) and the detailed (B) views of the binding pocket of free SAM-II riboswitch formed by U11, U21, and A45. Red (−10 kT/e) and blue (+10 kT/e) areas depict electronegative and electropositive regions, respectively. Also shown are the detailed views of the binding pocket when (S,S)-SAM (C) with the electropositive sulfur or SAH (D) with the electronegative sulfur atom is bound to the riboswitch. The blue dot in the center of the electronegative pocket in C depicts the electropositive sulfur atom. Hydrogens are not shown in the above electrostatic potential map; however, they were included in the calculation of the map.




