


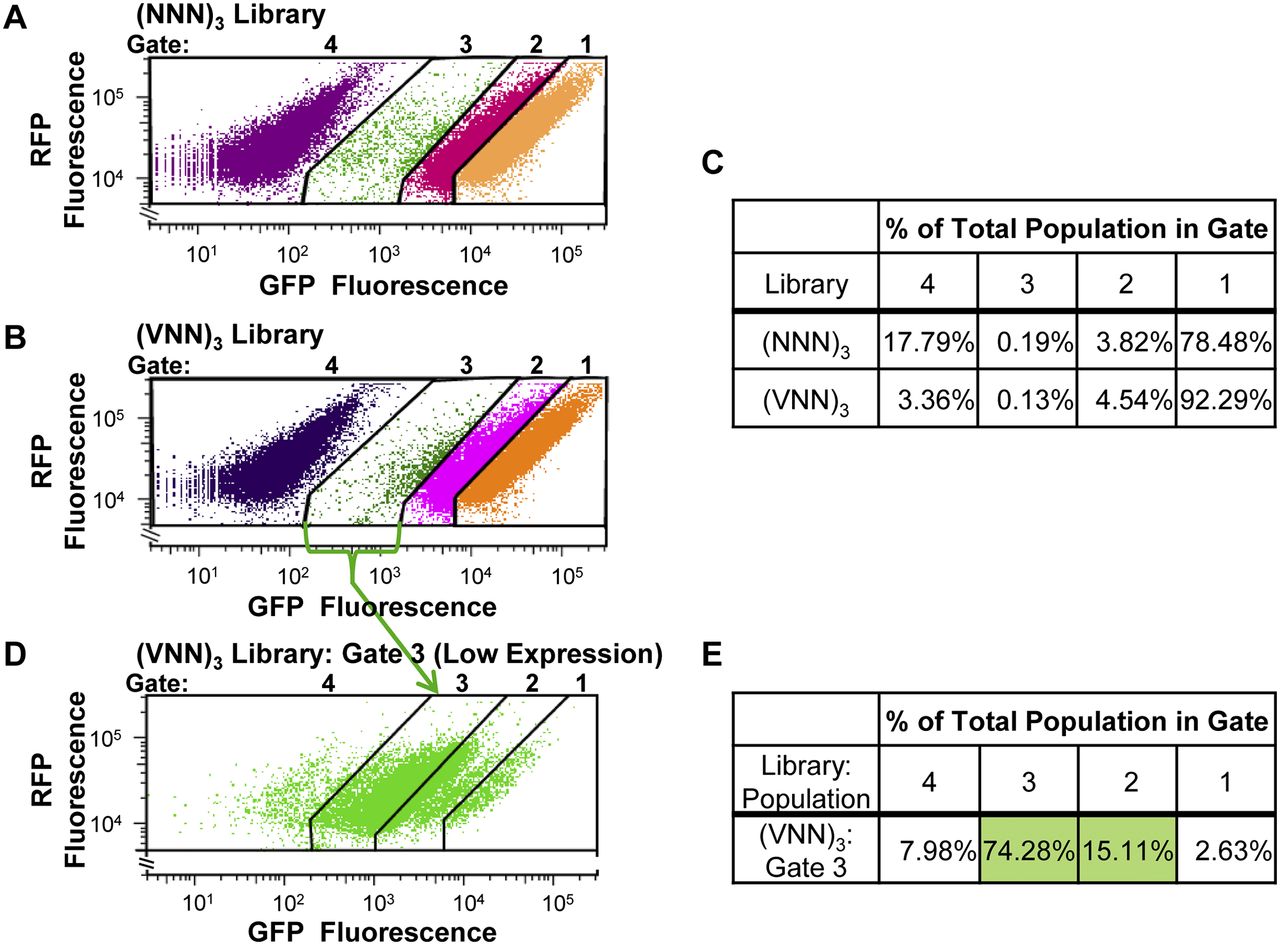
Libraries of three randomized codon inserts at residue 6 of GFP results in a fraction of cells with reduced GFP expression. (A) Scatter plot from FACS of 500,000 yeast cells bearing a library of three randomized codons, (NNN)3, inserted into GFP at residues 6–8. (B) Scatter plot from FACS of 500,000 yeast cells bearing a library of three semi-randomized codons, (VNN)3, inserted into GFP at residues 6–8. V is A, G, or C. (C) Quantification of the fraction of the total population of each library that migrates in each gate. (D,E) Yeast strains that migrate into Gate 3, the low-expression gate, are strongly enriched for strains that exhibit low expression when regrown. (D) Scatter plot of GFP versus RFP fluorescence of cells from the (VNN)3 library that migrated in Gate 3 in B, and were then regrown and re-examined by flow cytometry. (E) Quantification of the fraction of cells regrown from Gate 3 that migrate into each gate when reanalyzed.




