


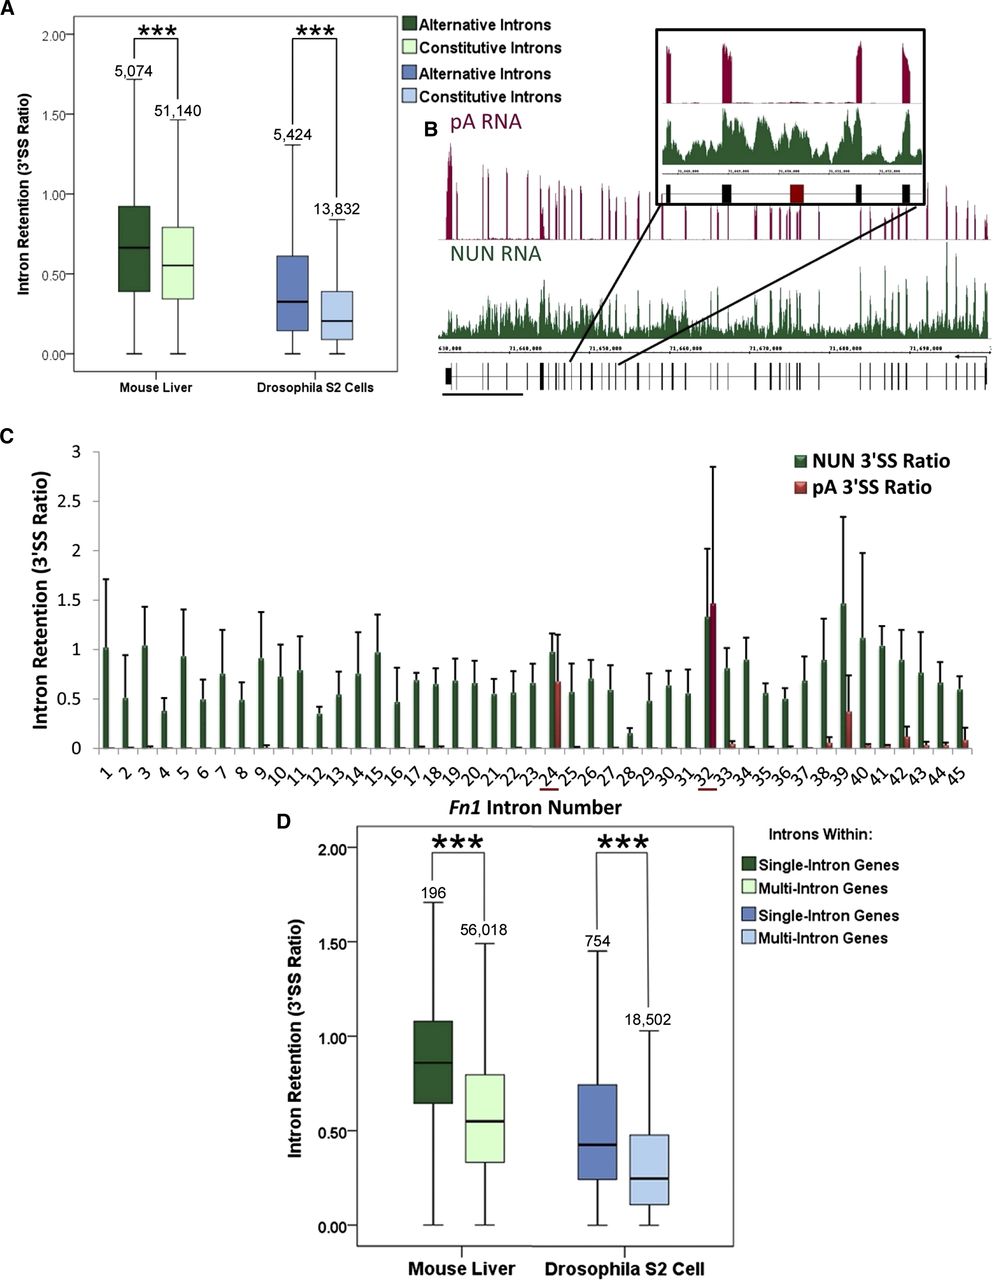
Special cases: Alternatively annotated introns and introns within single-intron genes correlate with poorer cotranscriptional splicing efficiency in both Drosophila and mouse. (A) Alternatively annotated introns (dark green, dark blue) show significantly greater 3′SS ratios than constitutively annotated introns (light green, light blue) in mouse (green) and fly (blue) (***, P < 0.001, Mann-Whitney U-Test). (B) An image of the mouse Fibronectin (Fn1) gene in IGB. (Magenta) pA RNA; (green) NUN RNA; (black) gene structure. (Black bar) 10,000 bp. The structure does not note alternative isoforms that exclude alternative exons, such as the one shown in the inset. NUN average reads/bp in the exons ∼29. (C) A quantitation of intron retention of all introns in Fn1. Note that introns 24 and 32 have artificially high 3′SS ratios in the pA fraction due to lack of signal in the 3′ exon. (D) Introns located within single-intron genes (dark green, dark blue) show significantly higher 3′SS ratios than introns within multi-intron genes (light green, light blue) in both mouse (green) and fly (blue) (***, P < 0.001, Mann-Whitney U-Test). Box plots span the 95th–fifth percentiles.




