


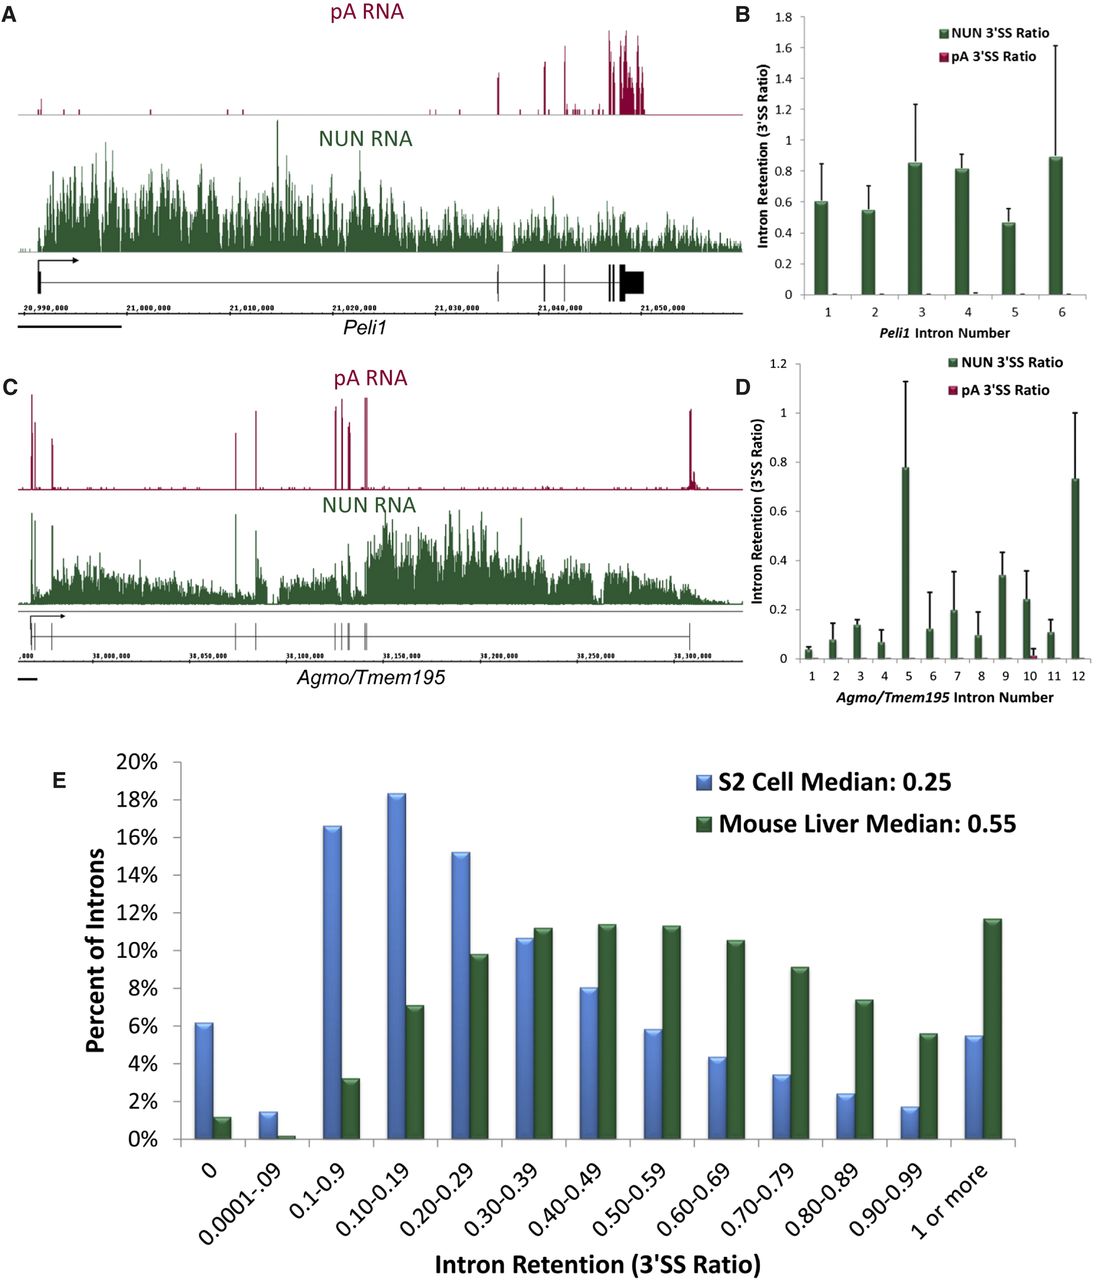
Cotranscriptional splicing is twofold less efficient in mouse liver than in Drosophila S2 cells. (A) An image of a typical mouse gene, Peli1, in the Integrated Genome Browser (IGB). (Magenta) pA RNA; (green) NUN RNA; (black) gene structure. (Black bar) 10,000 bp. Note 5′-to-3′ abundance gradient in NUN fraction and abundant read signal within introns. NUN average reads/bp in the exons ∼5.5. (B) Quantitation of intron retention for the introns of Peli1. Intron Retention as 3′SS Ratio = Reads in last 25 bp of Intron/Reads in the first 25 bp of the 3′ exon. (C) Another gene, Agmo/Tmem195, which illustrates greater splicing in the introns closer to the 5′ end of the gene and a mostly unspliced last intron. NUN average reads per base pair in the exons ∼17.4. (D) Quantitation of intron retention for the introns of Agmo/Tmem195. (E) A histogram of intron retention as measured by the 3′SS ratio of all introns in abundantly transcribed genes in mouse and fly. (Blue) Fly NUN RNA; (green) mouse NUN RNA. Total sample size: mouse NUN = 58,493; fly NUN = 20,335 introns.




