


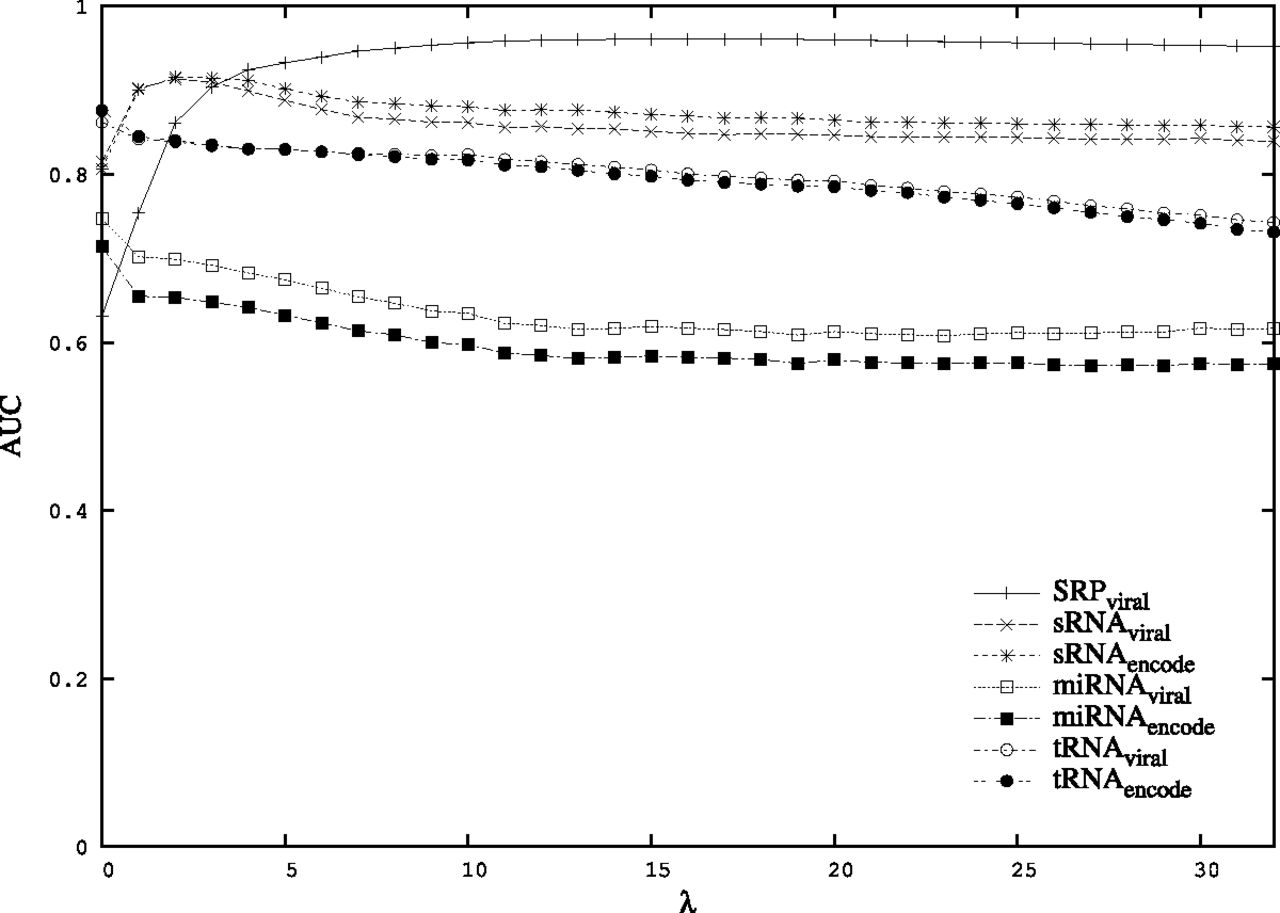
FIGURE 3.
Benchmarking the weight factor λ. For each data set, namely SRP, sRNA, miRNA, and tRNA, the area under the curve (AUC) of the ROC curve with regard to the background set, either “viral” or “encode,” is plotted for varying λ. Note that the SRP data set is provided containing only “viral” background data.




