


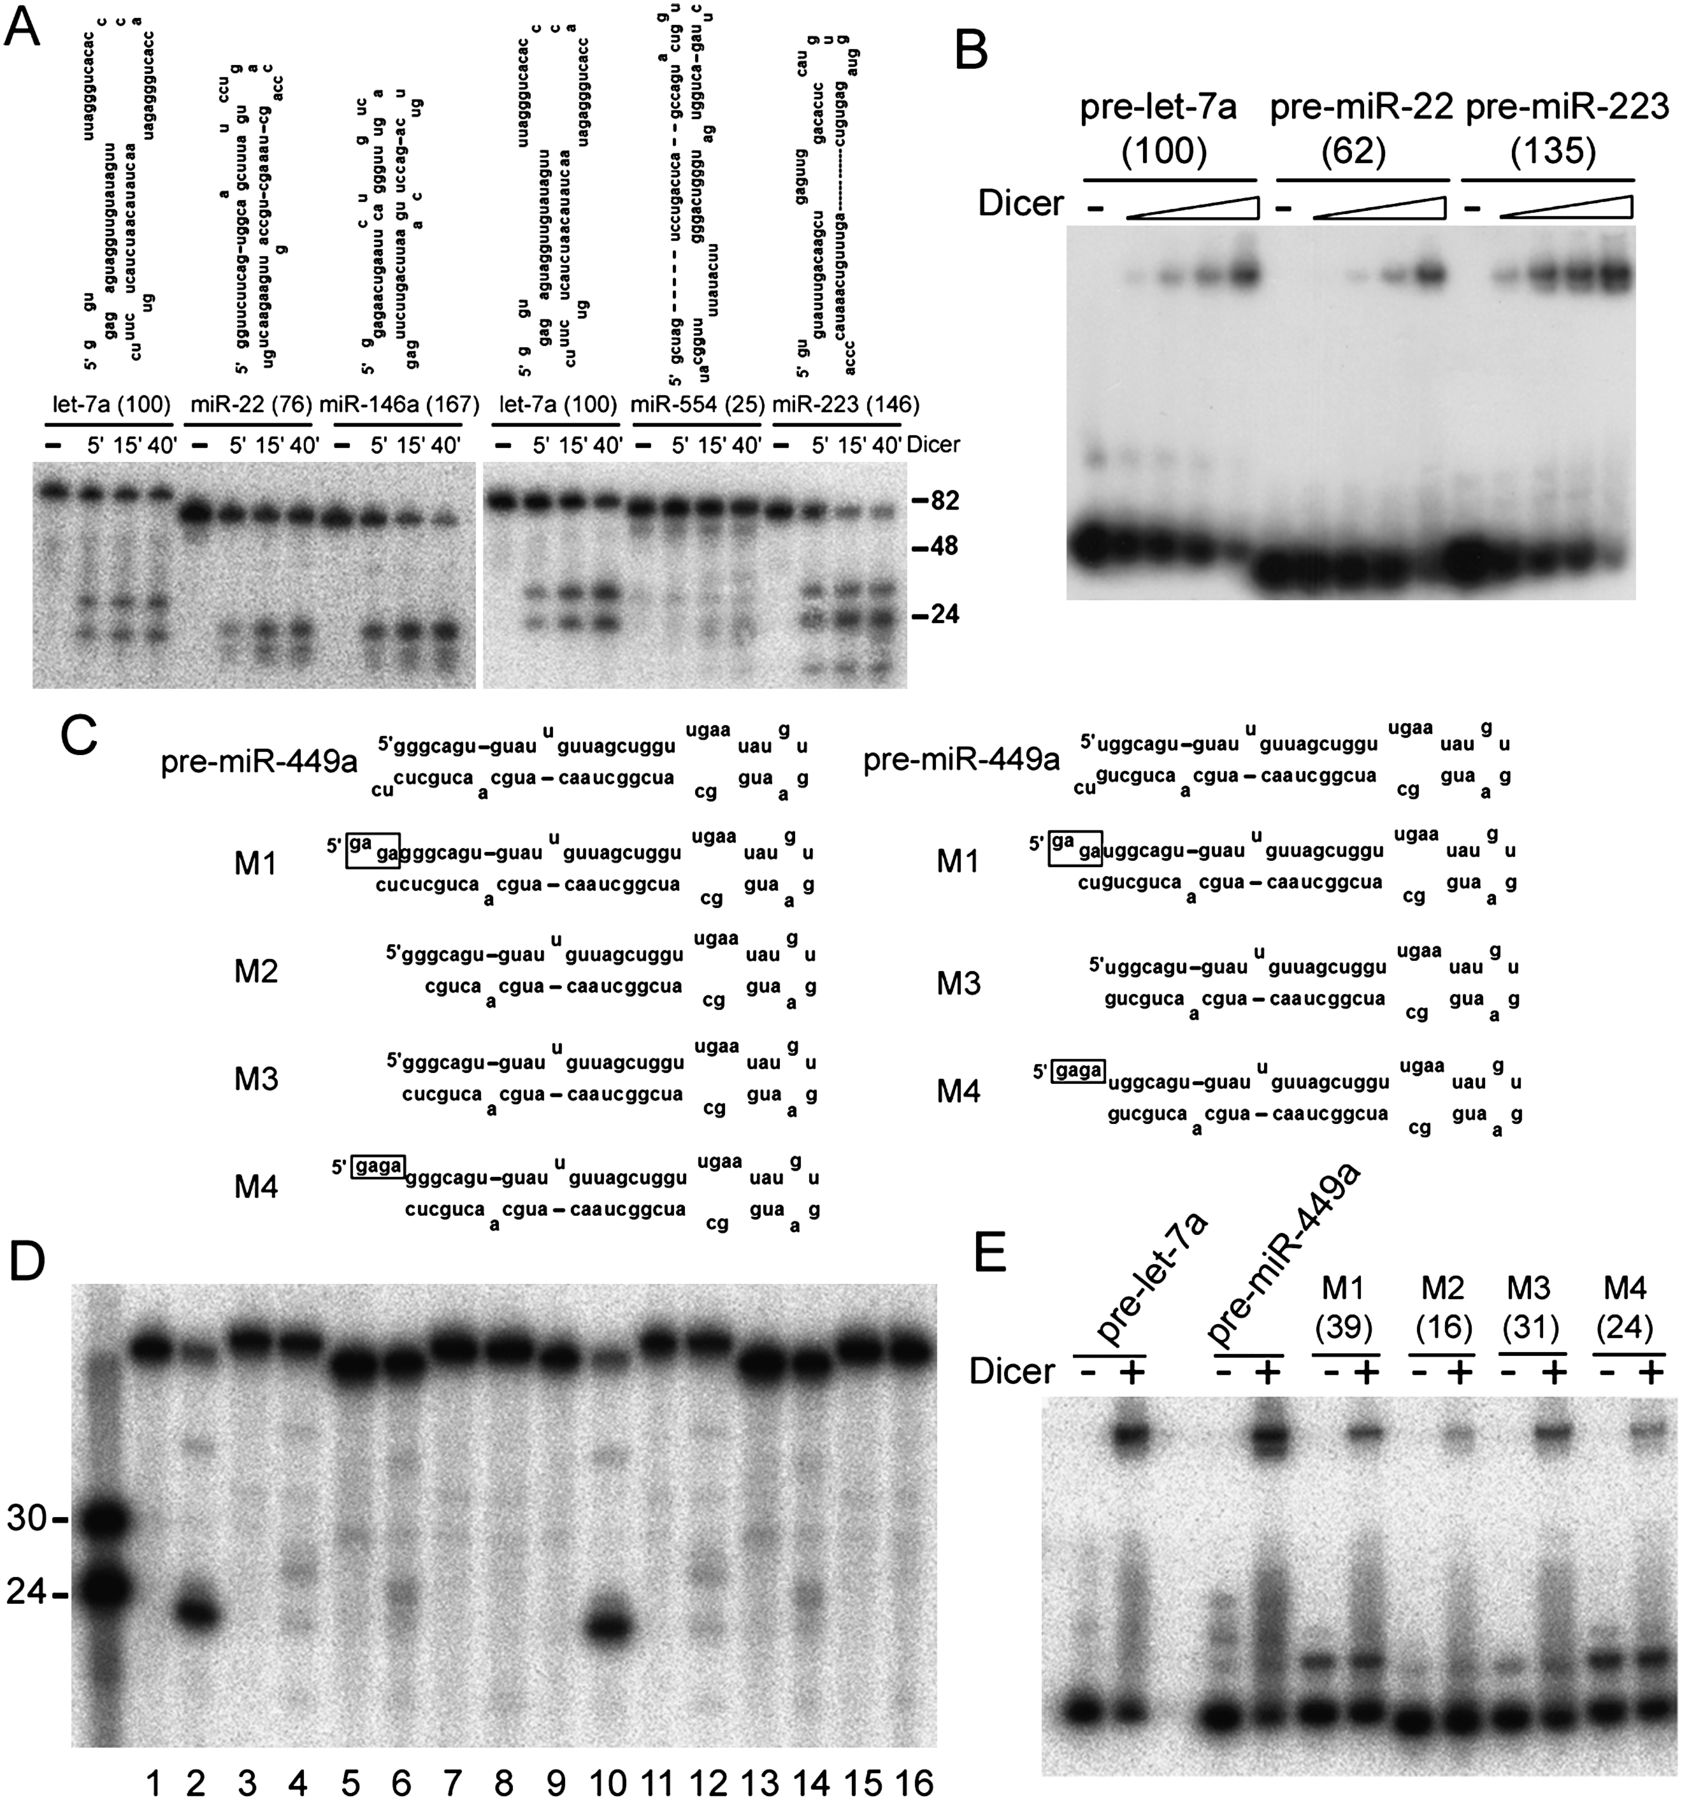
hDicer processing of pre-miRNAs with different end structures. (A) Pre-miRNAs with the predicted secondary structures shown on top were incubated with hDicer for 5, 15, and 40 min. Sizes of DNA markers (in nucleotides) are indicated at the right. Relative hDicer cleavage efficiencies are in parentheses (Supplemental Table 1). (B) Gel shift assays with increasing amounts of hDicer incubated with the indicated pre-miRNAs. Relative hDicer binding efficiencies under the highest hDicer concentration are listed in parentheses. (C) Predicted secondary structures of pre-miR-449a and its mutants. Shown on the left are the expected, in vitro transcribed RNAs, and on the right are the chemically synthesized RNAs. Added sequences are marked with a box. (D) Dicing assay of RNAs in C. (Lanes 1,3,5,7,9,11,13,15) No hDicer; (lanes 2,4,6,8,10,12,14,16) incubated with hDicer; (lanes 1–8) in vitro transcribed RNAs as substrates; (lanes 9–16) chemically synthesized RNAs; (lanes 1,2,9,10) wild-type pre-miR-449a; (lanes 3,4,11,12) M1 mutant; (lanes 5,6,13,14) M3 mutant; (lanes 7,8,15,16) M4 mutant. RNA markers (in nucleotides) are shown at the left. (E) Gel shift assay. The indicated pre-miRNAs and mutants were incubated with hDicer on ice and then run on a native gel. Relative hDicer binding efficiencies in parentheses were calculated by normalizing to that of pre-miR-449a, which was set at 100 (data not shown). RNAs shown in A, B, and E were tested at least twice. A representative result of three independent experiments is shown in D.




