


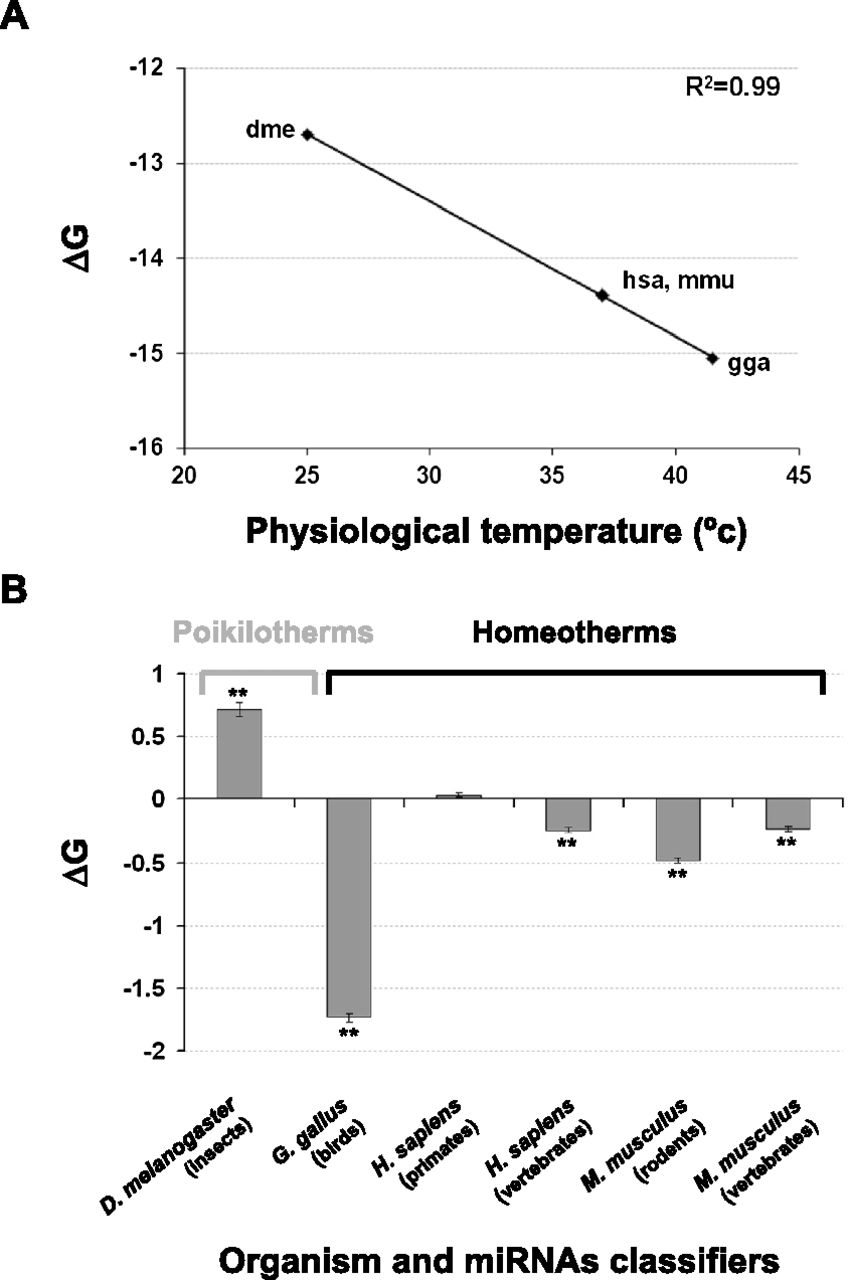
The free energy (ΔG) of the base-pairings between miRNAs and their predicted targets inversely correlates with the organism's physiological temperature. We used the ΔG values for the base-pairing of miRNAs and their targets predicted from TargetSpy (Sturm et al. 2010). (A) Shown is the average ΔG for the miRNA–target base-pairing of four model organisms available in TargetSpy plotted against the organism's physiological temperature. The regression line and the correlation coefficient are shown. (dme) D. melanogaster (fly); (hsa) H. sapiens (human); (mmu) M. musculus (mouse); (gga) G. gallus (chicken). (B) For each of the organisms, we divided the miRNAs into two subsets that contain (1) miRNAs that are specific to a taxonomic group and (2) the rest of the miRNAs that are shared with other taxonomic groups. Each bar shows the difference between the average ΔG values of the two subsets for the predicted miRNA–target binding sites ± standard error of the difference between two means. The label under each bar describes the organism and miRNA classifiers (i.e., the taxonomic group according to which we sorted the organism miRNAs into two subsets). (**) p < 0.0005 as indicated.




