


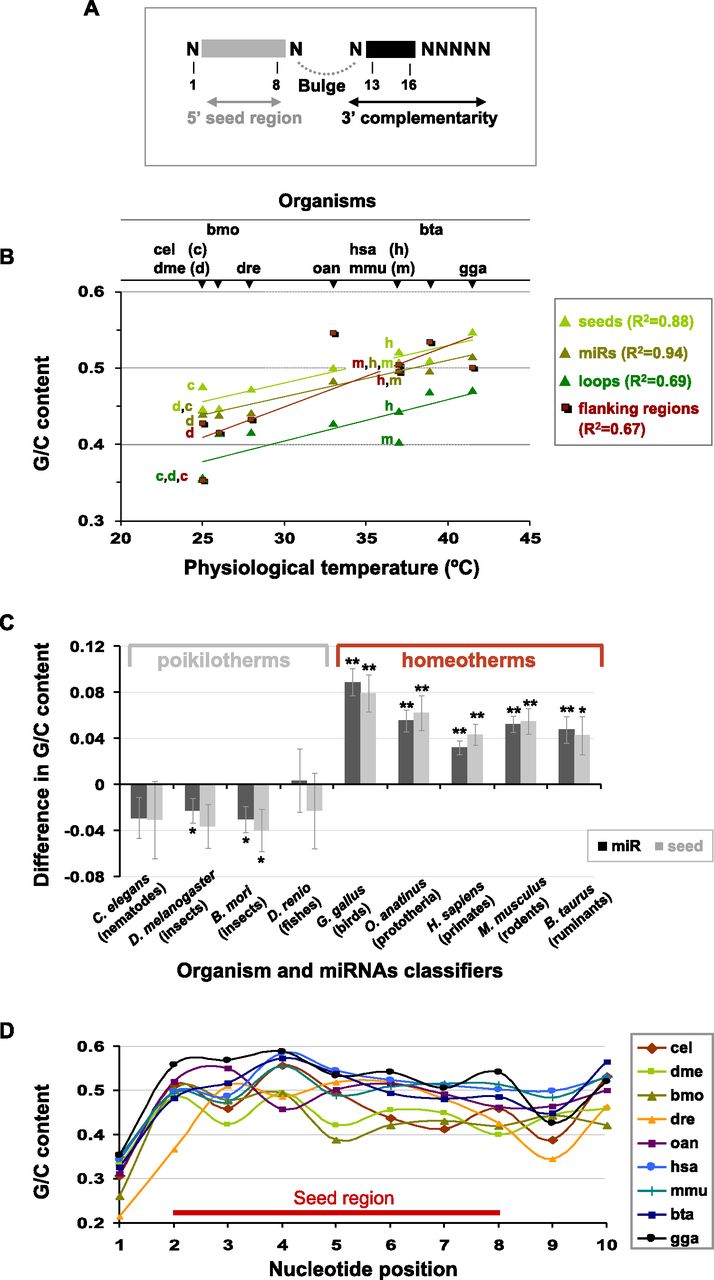
miRNA G/C content correlates to the physiological temperature of an organism. (A) A scheme of the different regions of miRNA (modified from Filipowicz et al. 2008, with permission of Nature Publishing Group, © 2008). (B) The average G/C content of miRNA sequences, their seeds, the pre-miRNA loops, and the pre-miRNA flanking regions were calculated for nine representative model organisms and plotted against the physiological temperature of each organism. (Khaki triangles) miRNAs; (light green triangles) seeds; (dark green triangles) loops; (brown shadowed squares) the control flanking regions. The regression lines and their correlation coefficients for each of the subsets of values are shown in the corresponding color. The organisms' labels are shown above the arrowheads that point to the organism's physiological temperature: (cel) Caenorhabditis elegans (nematode); (dme) Drosophila melanogaster (fly); (bmo) Bombyx mori (silkmoth); (dre) Danio rerio (zebrafish); (oan) Ornithorhynchus anatinus (platypus); (hsa) Homo sapiens (human); (mmu) Mus musculus (mouse); (bta) Bos taurus (cow); (gga) Gallus gallus (chicken). For organisms that have the same physiological temperature, we added next to the data point the first letter of the organism in a color that corresponds to the data that it represents (e.g., d in light green stands for D. melanogaster seeds, d in khaki for miRNAs, etc.). (C) For each of the organisms, we divided its miRNAs into two subsets that contain (1) miRNAs that are specific to a taxonomic group (e.g., Drosophila insect-specific miRNAs) and (2) the rest of the miRNAs that are shared by other taxonomic groups (e.g., Drosophila miRNAs that are not insect-specific). Each pair of bars shows the difference in G/C content between these two subsets for miRNAs (black) and for seeds (dark gray) ± standard error of the difference between two means. The label under each bar pair describes the organism and miRNAs classifiers (i.e., the taxonomic group according to which we sorted the organism miRNAs into two subsets). (*) p < 0.05; (**) p < 0.0005 as indicated. (D) The average G/C level of the first 10 positions of miRNAs sequence in nine model organisms: (cel) C. elegans (nematode); (dme) D. melanogaster (fly); (bmo) B. mori (silkmoth); (dre) D. rerio (zebrafish); (oan) O. anatinus (platypus); (hsa) H. sapiens (human); (mmu) M. musculus (mouse); (bta) B. taurus (cow); (gga) G. gallus (chicken).




