


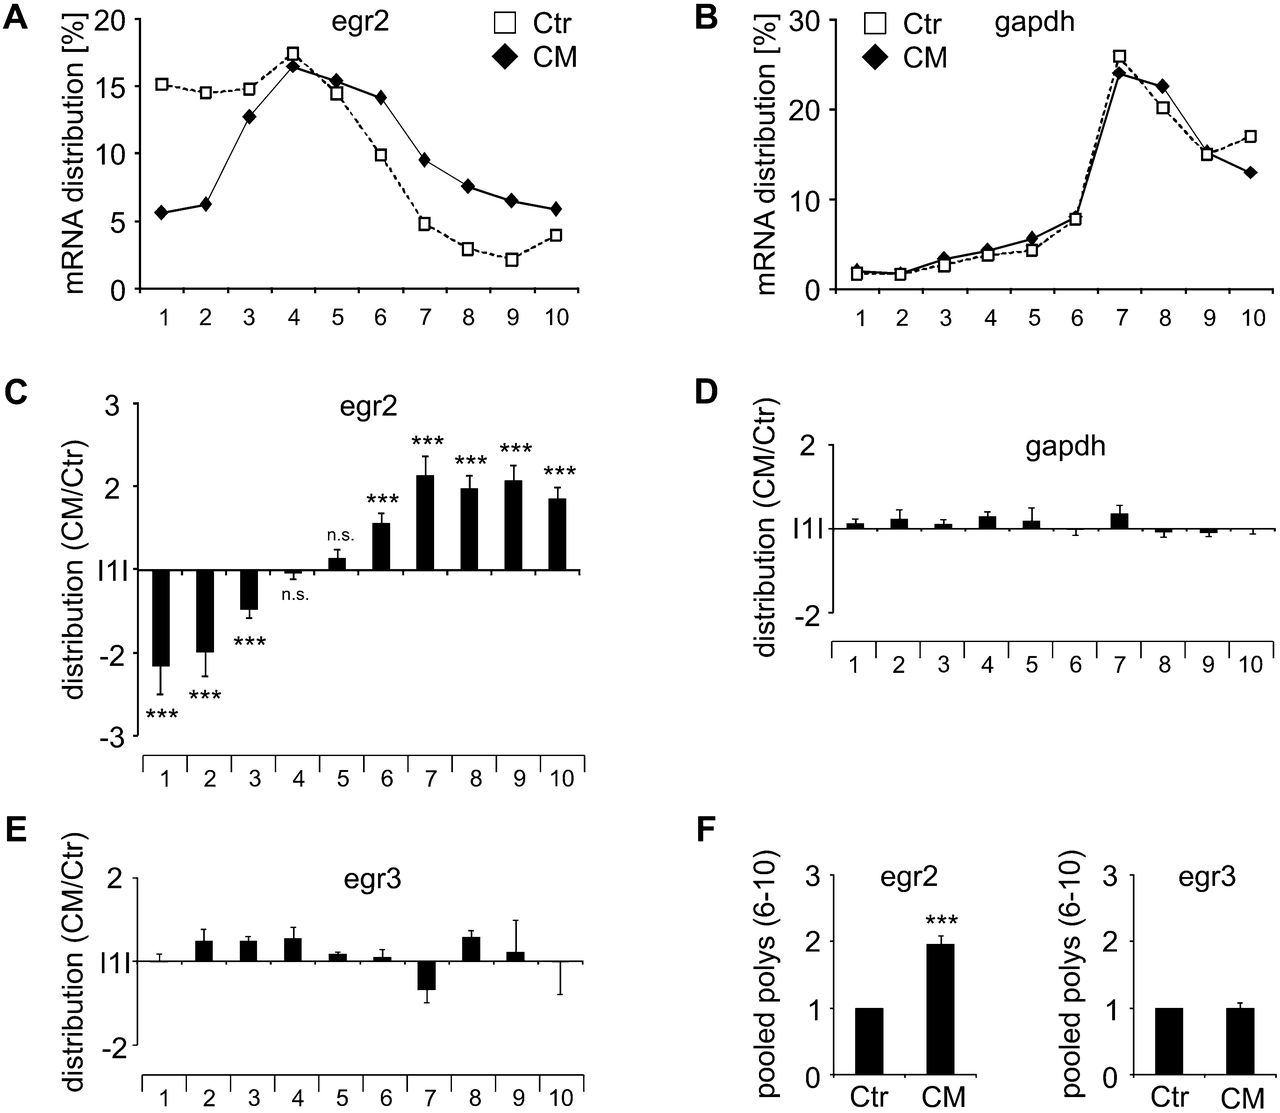
Egr2 is translationally up-regulated. MCF7 cells were treated with CM (black diamonds, solid line) or Ctr (white squares, dashed line) for 4 h and subjected to polysomal fractionation. RNA was isolated from single fractions and analyzed using RT-qPCR. The relative mRNA distribution of egr2 (A) and gapdh (B) is shown. Graphs are representative for at least three independent experiments. The ratio of mRNA distribution of CM to Ctr was calculated to visualize stimulus-dependent changes in single fractions for egr2 (C), gapdh (D), and egr3 (E). (F) Pooled polysomal changes (fractions 6–10) of egr2 (left panel) and egr3 (right panel) in response to CM were determined relative to Ctr and normalized to gapdh. Data are presented as means ± SEM (n > 3). (***) P < 0.001.




