


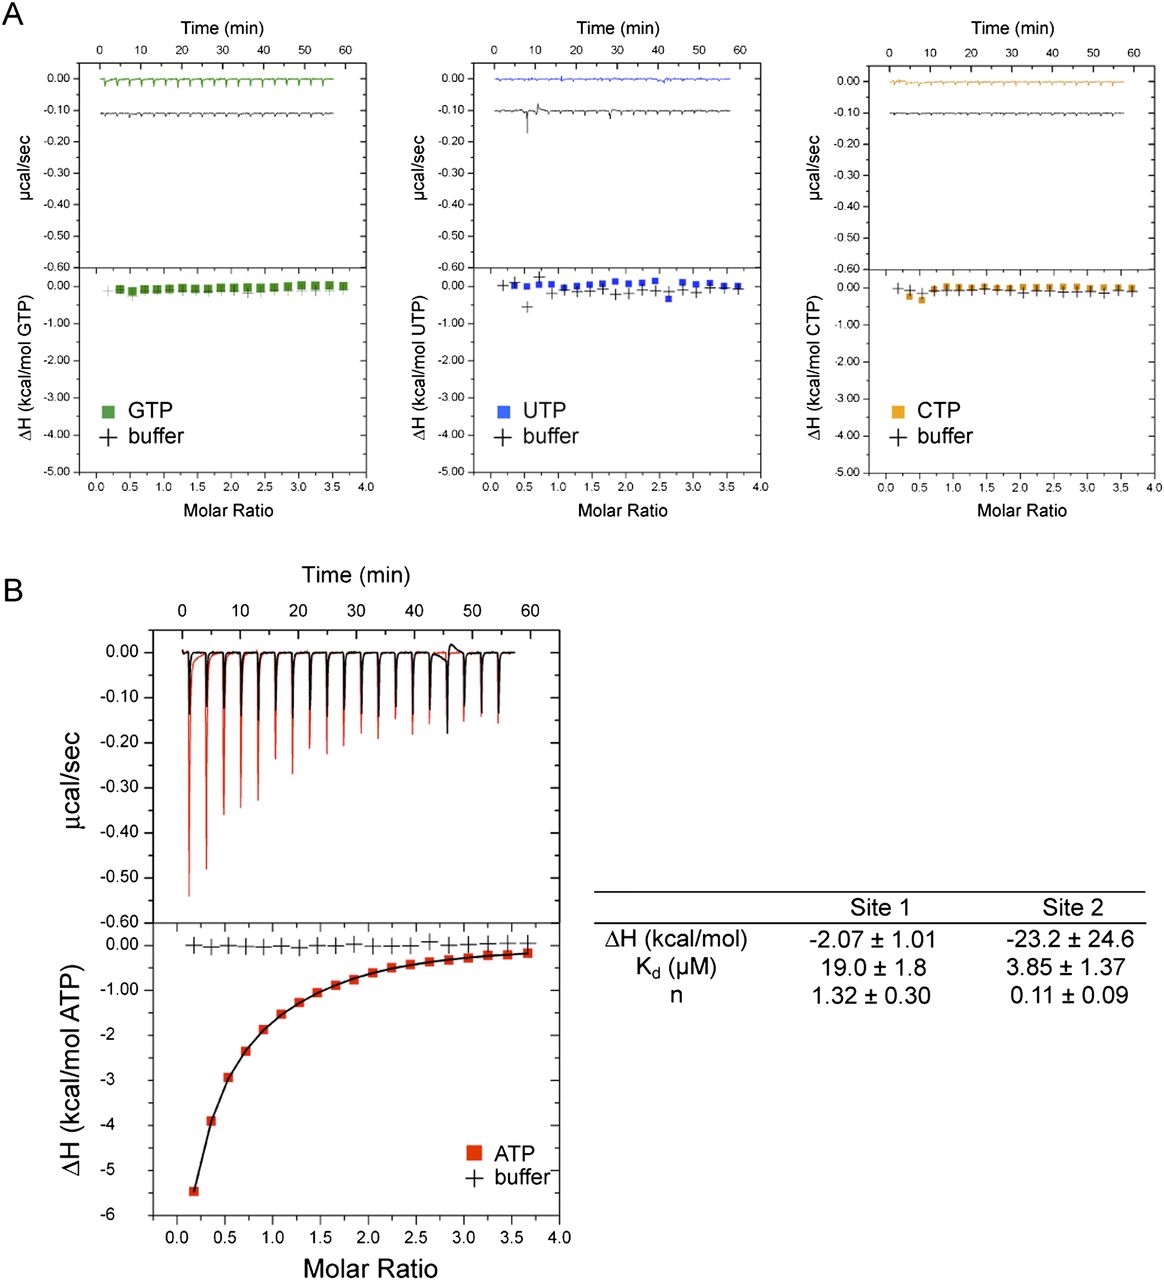
The ATP binding site has high affinity: ITC experiments. ITC titration curves for NTP binding to K296R. (A) GTP (green trace), UTP (blue trace), and CTP (orange trace) binding to K296R. Titration of each NTP into buffer is included (black traces). NTP traces are offset from buffer traces by ∼0.1 μcal/sec in raw data (upper panels) for clarity. Legends are provided in plots. (B) ATP binding to K296R (red trace). Titration of ATP into buffer is included (black trace). ATP titration curve is fitted to a two-site binding model (see Materials and Methods), and thermodynamic parameters are provided to the right of the plot. The major contribution is with site 1 (n = 1.32 ± 0.09) and a Kd of 19 ± 1.8 μM. Note that uncertainty in ΔH is due to the lack of a good lower baseline, which is common with micromolar Kd experiments. However, this does not affect the Kd value because that is mainly based on the slope of the transition region.




