


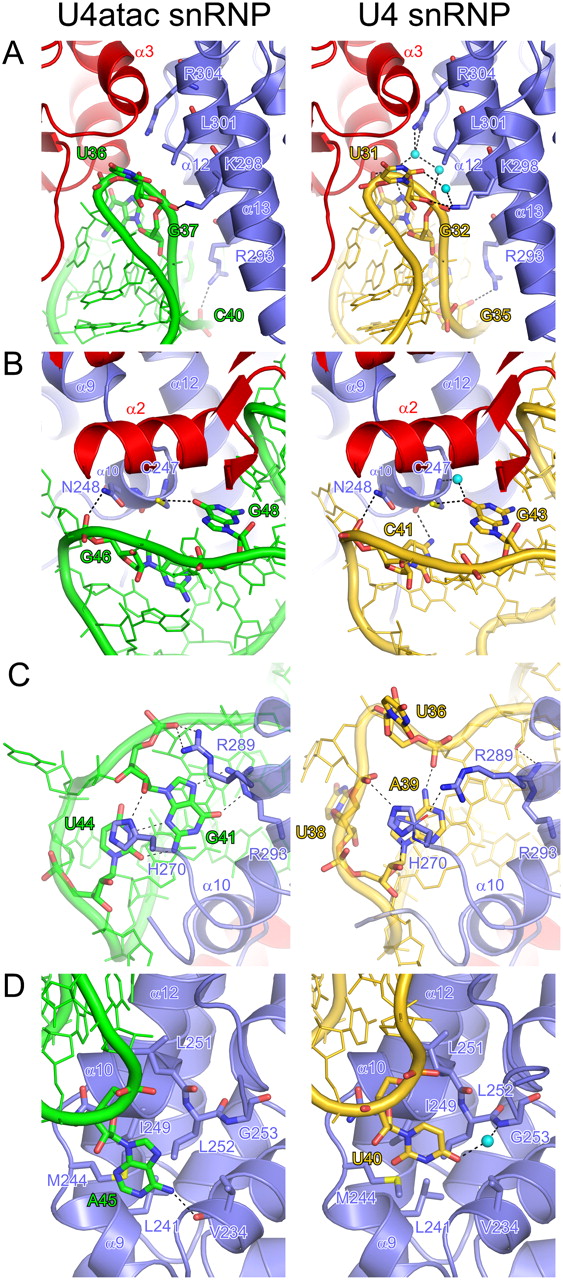
FIGURE 2.
Comparison of Prp31–U4atac and Prp31–U4 interactions. Ribbon plots showing details of the interaction of hPrp31 with the U4atac (left) and U4 snRNA (right). (A) Interaction at the K-turn region. (B) Interaction at the stem II region. (C) Interaction at the pentaloop. (D) Interaction at the terminus of the pentaloop. Coloring as before. Selected interacting residues are shown as sticks, colored by atom type and labeled. Carbon and phosphorus—as the respective molecule; nitrogen, blue; oxygen, red; sulfur, yellow. Dashed lines indicate hydrogen bonds or salt bridges. Cyan spheres, water molecules.




