


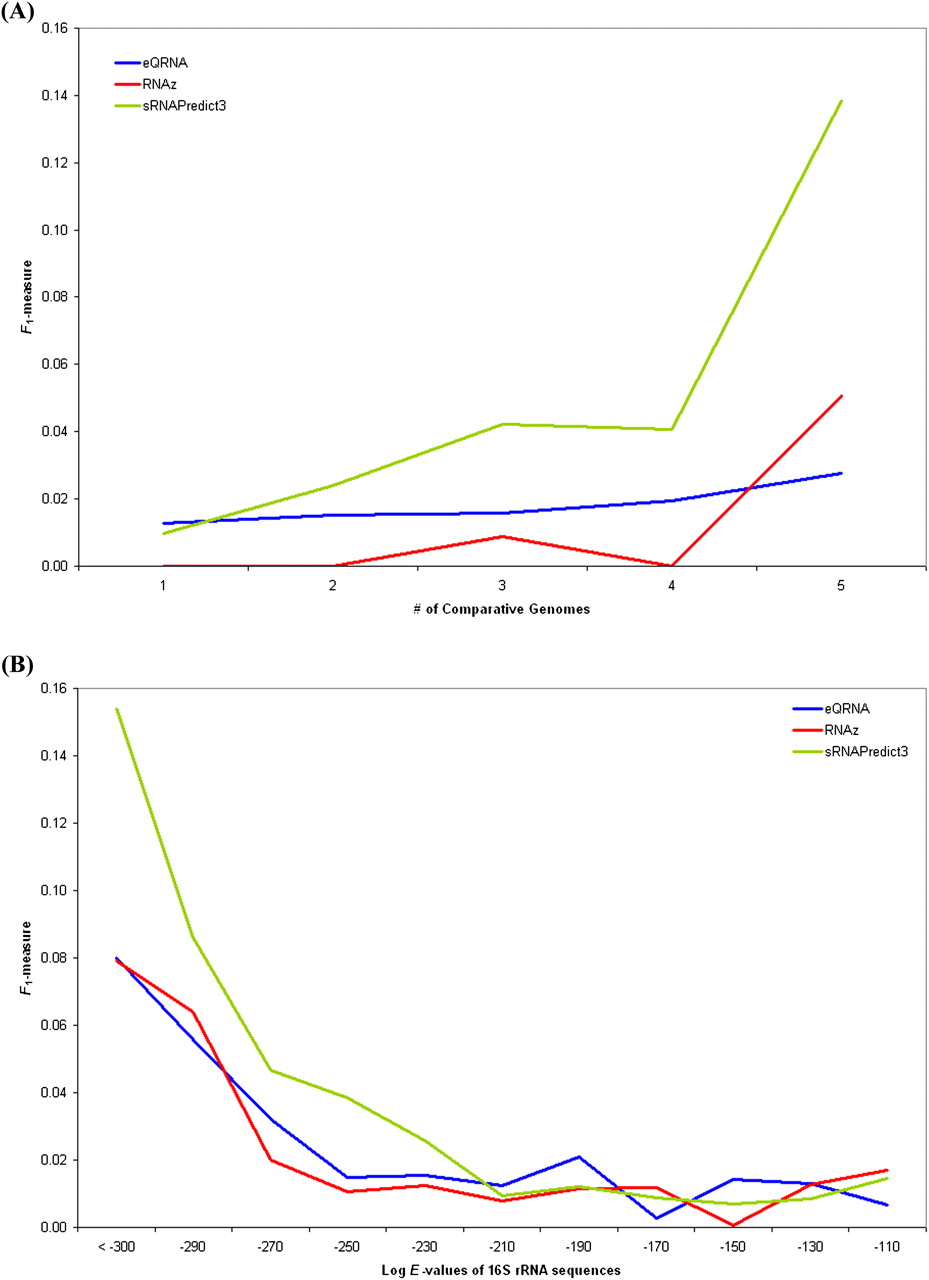
(A) The performance of eQRNA, RNAz, and sRNAPredict3 on the Rfam data set is shown as a function of the number of comparative genomes predicted to contain sRNAs by the tool. (B) The average performance across all 10 data sets is shown for eQRNA, RNAz, and sRNAPredict3 as a function of the approximate evolutionary distance of the genomes used by the program for comparative analysis. Evolutionary distance between genomes is approximated by the dissimilarity of 16S rRNA sequences as measured by BLAST E-value. Each line in the figure corresponds to 11 data points, where each data point is the average performance of a program across all 10 data sets. For each genome in the 10 data sets, five out of 1350 bacterial genomes were randomly selected at the given evolutionary distance and used by a program as comparative genomes to make sRNA predictions.




