


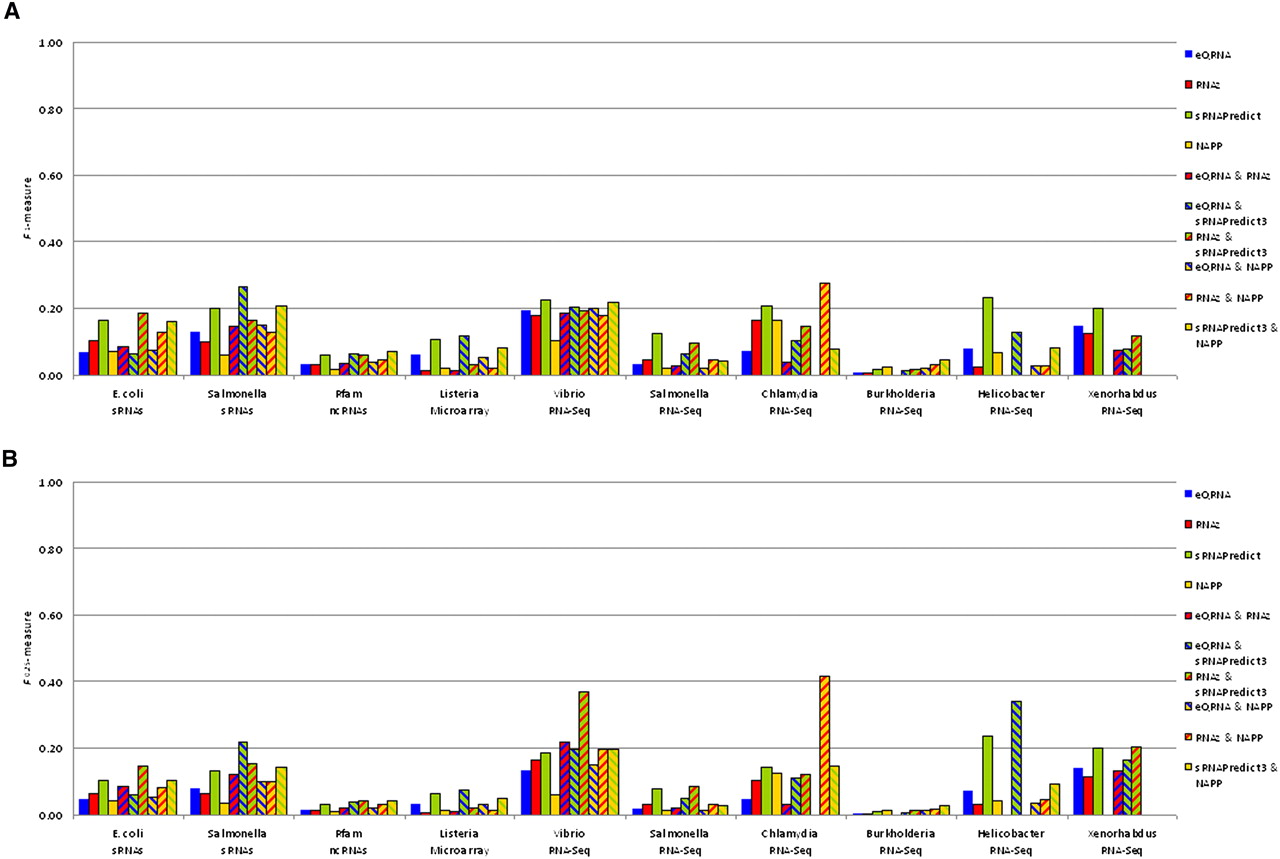
The F-measures for each tool individually (eQRNA, RNAz, sRNAPredict3, NAPP) as well as each pair of tools (eQRNA and RNAz, eQRNA and sRNAPredict3, RNAz and sRNAPredict3, eQRNA and NAPP, RNAz and NAPP, and sRNAPredict3 and NAPP) are shown for the 10 benchmark data sets. Predictions from pairs of tools correspond to overlapping predictions from both tools in the pair. NAPP was not assessed on the Xenorhabdus data set since predictions from NAPP were unavailable for this genome. (A) For each tool or pair of tools, the F1 measure, which weights sensitivity and precision equally, is shown. (B) For each tool or pair of tools, the F0.25 measure, which weights precision four times as much as sensitivity, is shown.




