


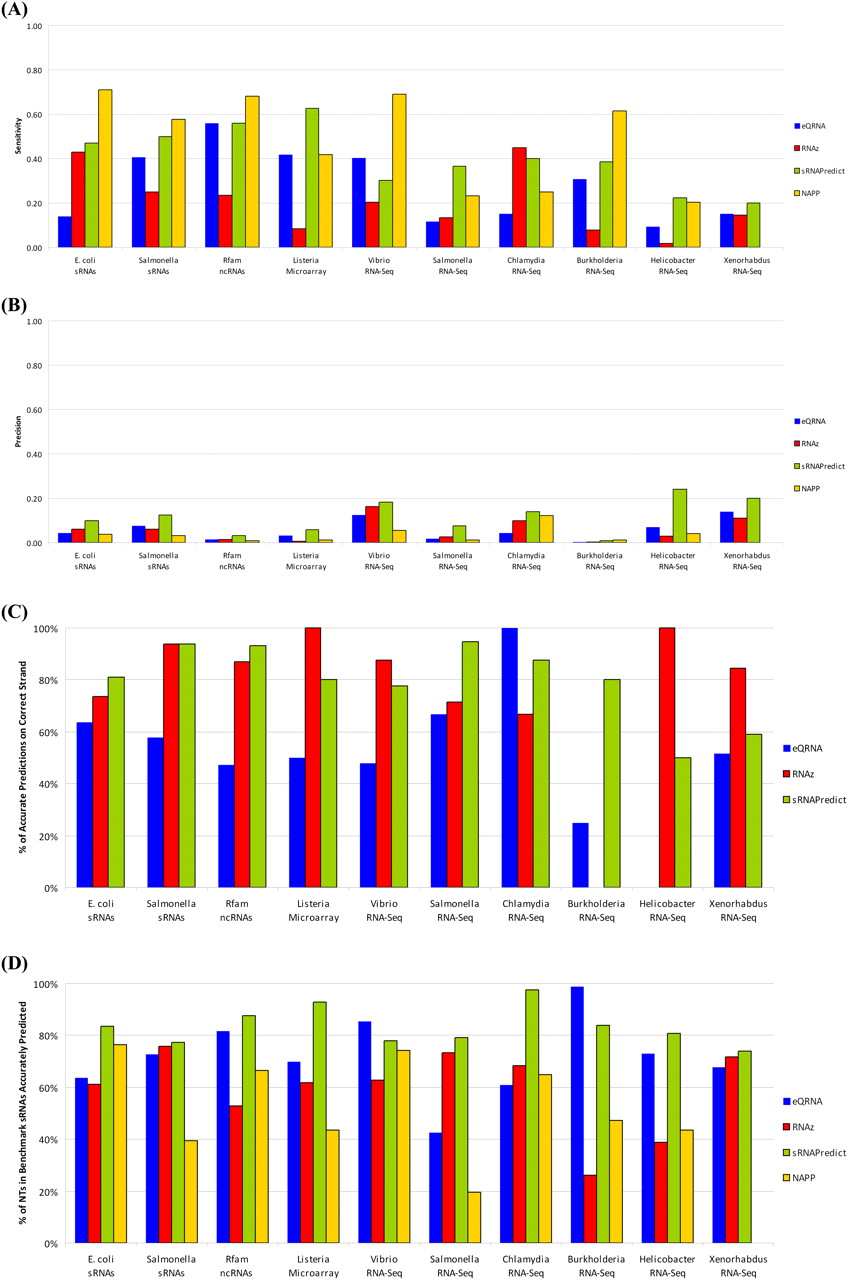
The performance of four tools on the 10 benchmark data sets is illustrated. NAPP was not assessed on the Xenorhabdus data set since predictions from NAPP were unavailable for this genome. (A) The sensitivity of each tool is shown. Here, a sRNA in the data set is designated as correctly predicted by a tool if a prediction overlaps any part of the sRNA. (B) The precision of each tool is shown. (C) For those predictions that overlap a sRNA from a data set, the percentage that identify the correct strand of the sRNA is shown. Predictions from NAPP are omitted since no strand information is provided by the tool. (D) For sRNAs from the data sets that are correctly predicted, the percentage of their nucleotides that is correctly identified is shown.




