


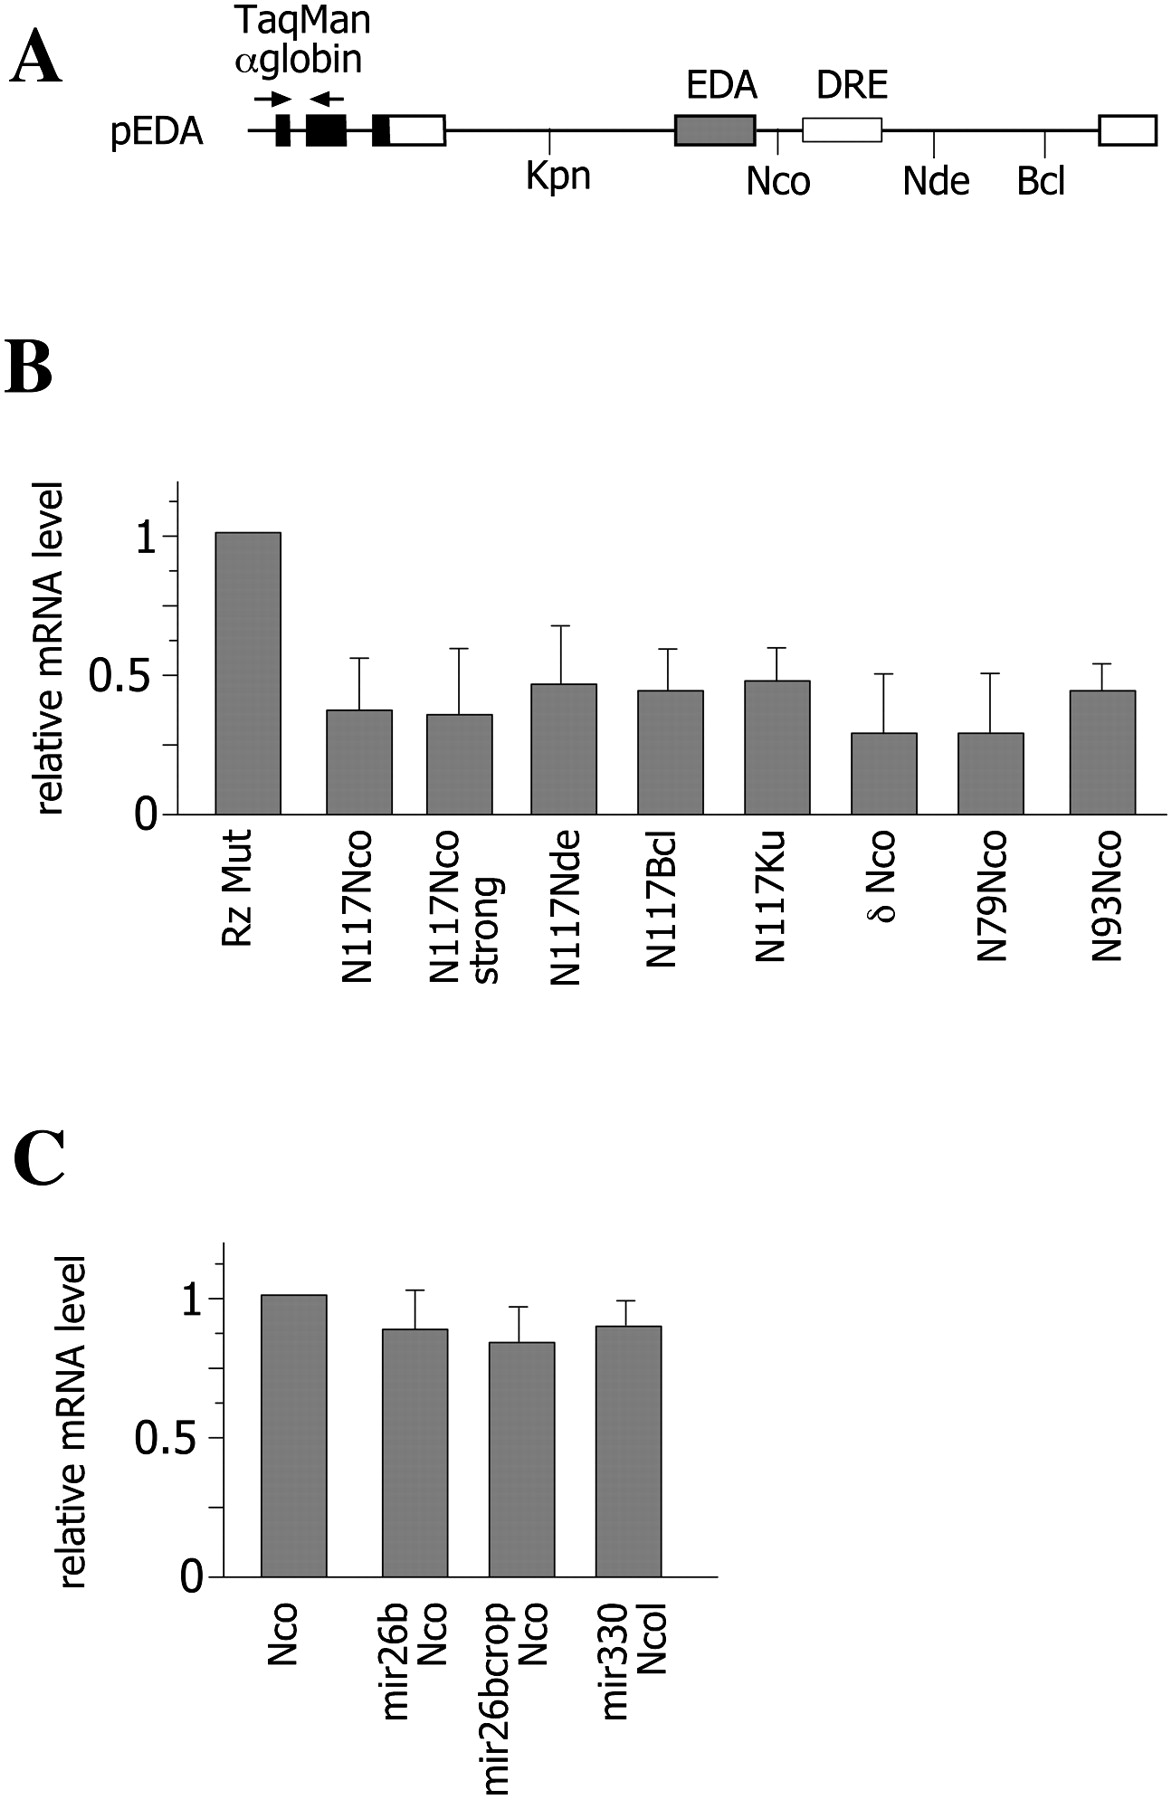
Analysis of gene expression in ribozyme- and MTS-derived minigenes. (A) Diagram of the fibronectin EDA minigene. Fibronectin exons (white boxes); α-globin exons (black boxes); introns (lines). The unique restriction sites in the introns used for wild-type (WT) or mutant ribozyme insertion are indicated. (Arrows) The positions of the TaqMan α-globin amplification primers. Minigenes were transfected in HeLa cells, and their expression levels were monitored by real-time PCR using a specific α-globin TaqMan assay. Each minigene (0.5 μg) was cotransfected with the control pCF1 (0.1 μg), which was used for normalization of transfection and reverse transcriptase efficiencies. (B) Relative expression levels of mRNAs produced from minigenes carrying WT or mutant ribozymes. The relative WT Rzs levels were normalized to the corresponding mutant Rz levels, and data are shown as the mean of at least two transfection experiments done in duplicate. Error bars represent the SEM. (C) Relative expression levels of mRNAs produced from miRNA-derived minigenes. The relative miRNA levels were normalized to the pEDA Nco empty vector levels, and data are shown as the mean of at least two transfection experiments done in duplicate. Error bars represent the SEM.




