


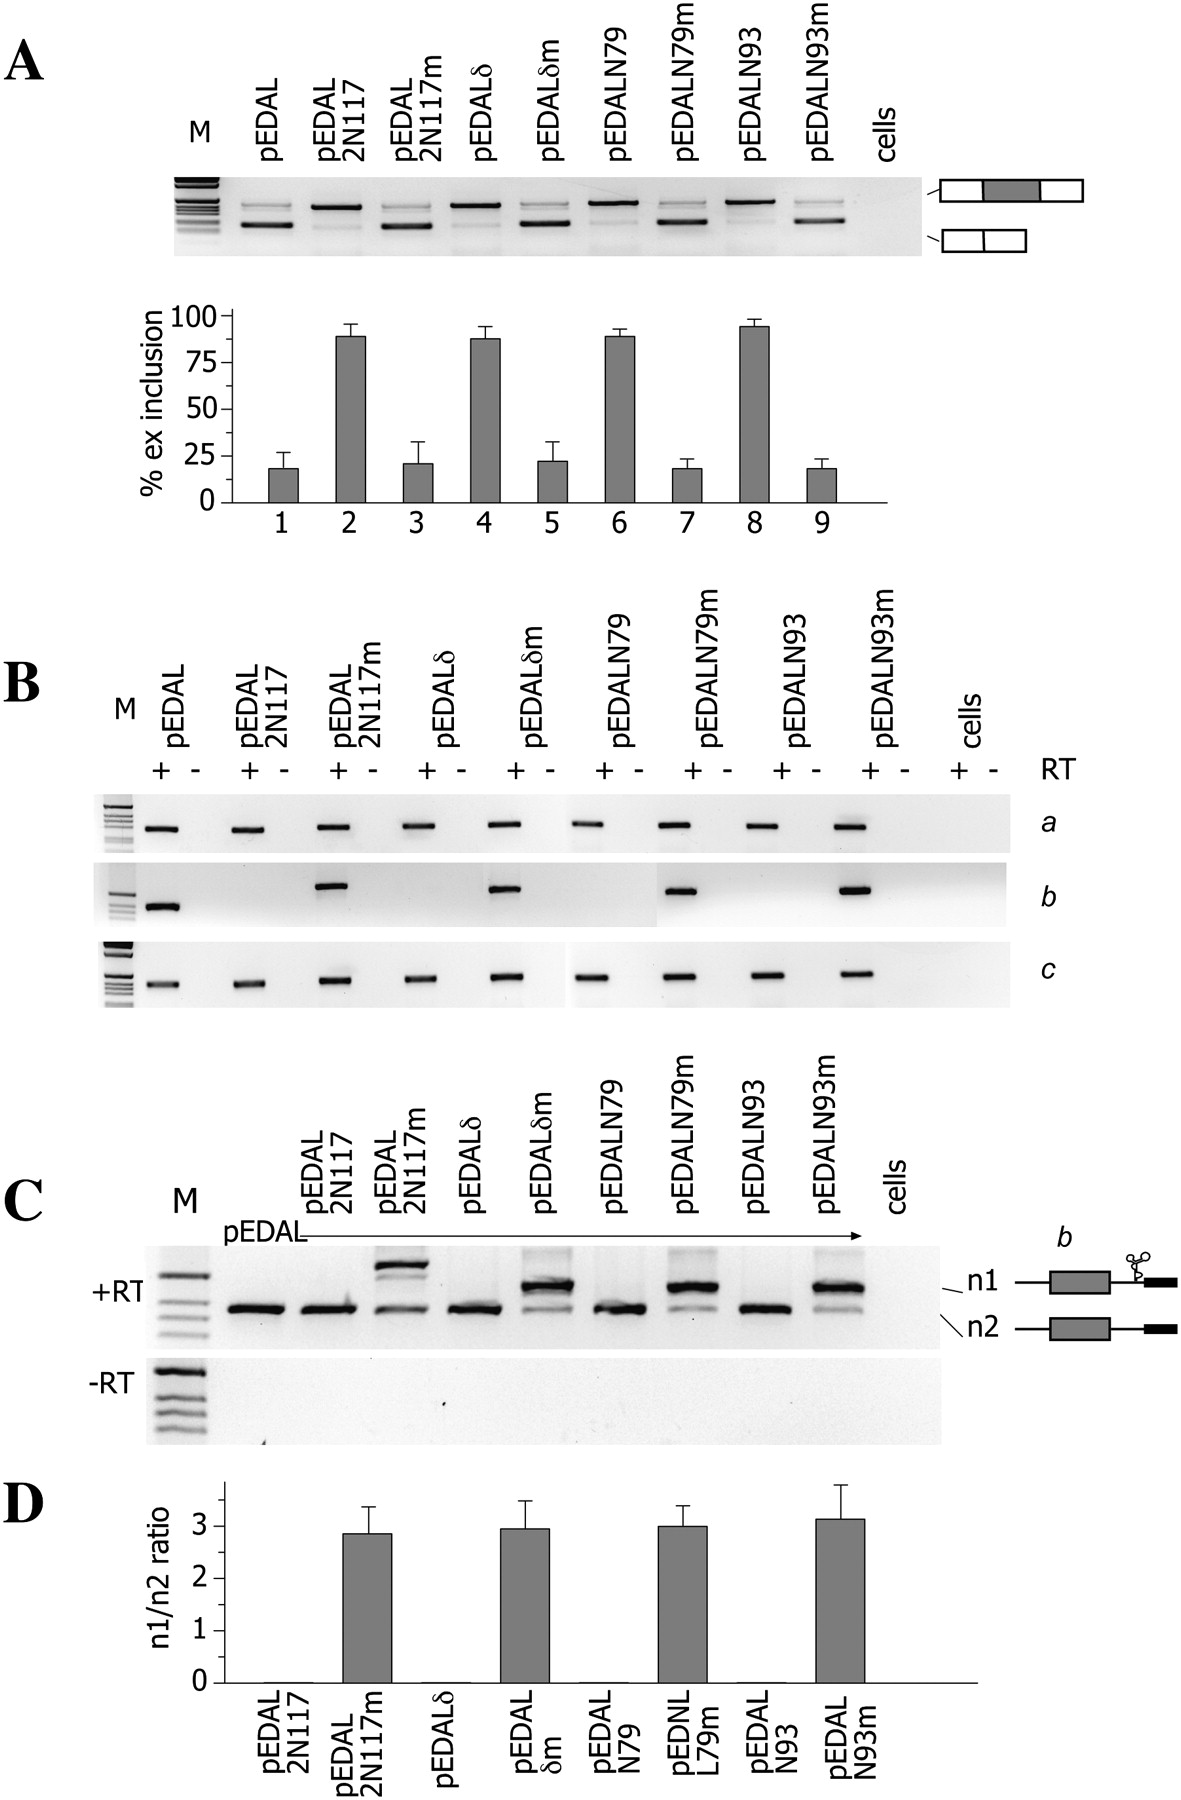
Effects of different ribozymes on EDA alternative splicing and nascent transcripts. (A) Analysis of mature spliced transcripts. The indicated minigenes derived from pEDAL (Fig. 1A) contain different Rzs or their corresponding inactive variant inserted between the EDA and the DRE. Minigenes were transfected into Hep3B cells, total RNA was extracted, and its splicing pattern was analyzed by RT-PCR. (M) The 1-kb molecular weight marker. The identity of the corresponding amplified bands is shown. The histogram shows the percentage of EDA exon inclusion, and data are the mean ± SD of three independent experiments performed in duplicate. (B) Analysis of nascent transcripts. Nascent transcripts derived from transfections of the indicated minigenes in cells were analyzed by RT-PCR using the specific pairs of primers indicated in Figure 1A. The identity of the bands (a, b, c) is shown. (C) Analysis of nascent b pre-mRNA transcript across the ribozyme. Minigenes (0.45 μg) were cotransfected with pEDAL (0.15 μg). Total RNA was amplified with the specific pair of primers indicated in Figure 1A. (M) The 1-kb molecular weight marker. The identity of the bands (n1 and n2) is shown. (Lower panel) A control PCR, without reverse transcriptase (−RT). (D) Quantification of n1 and n2 ratio of C expressed as the mean ± SD of two independent experiments done in duplicate.




