


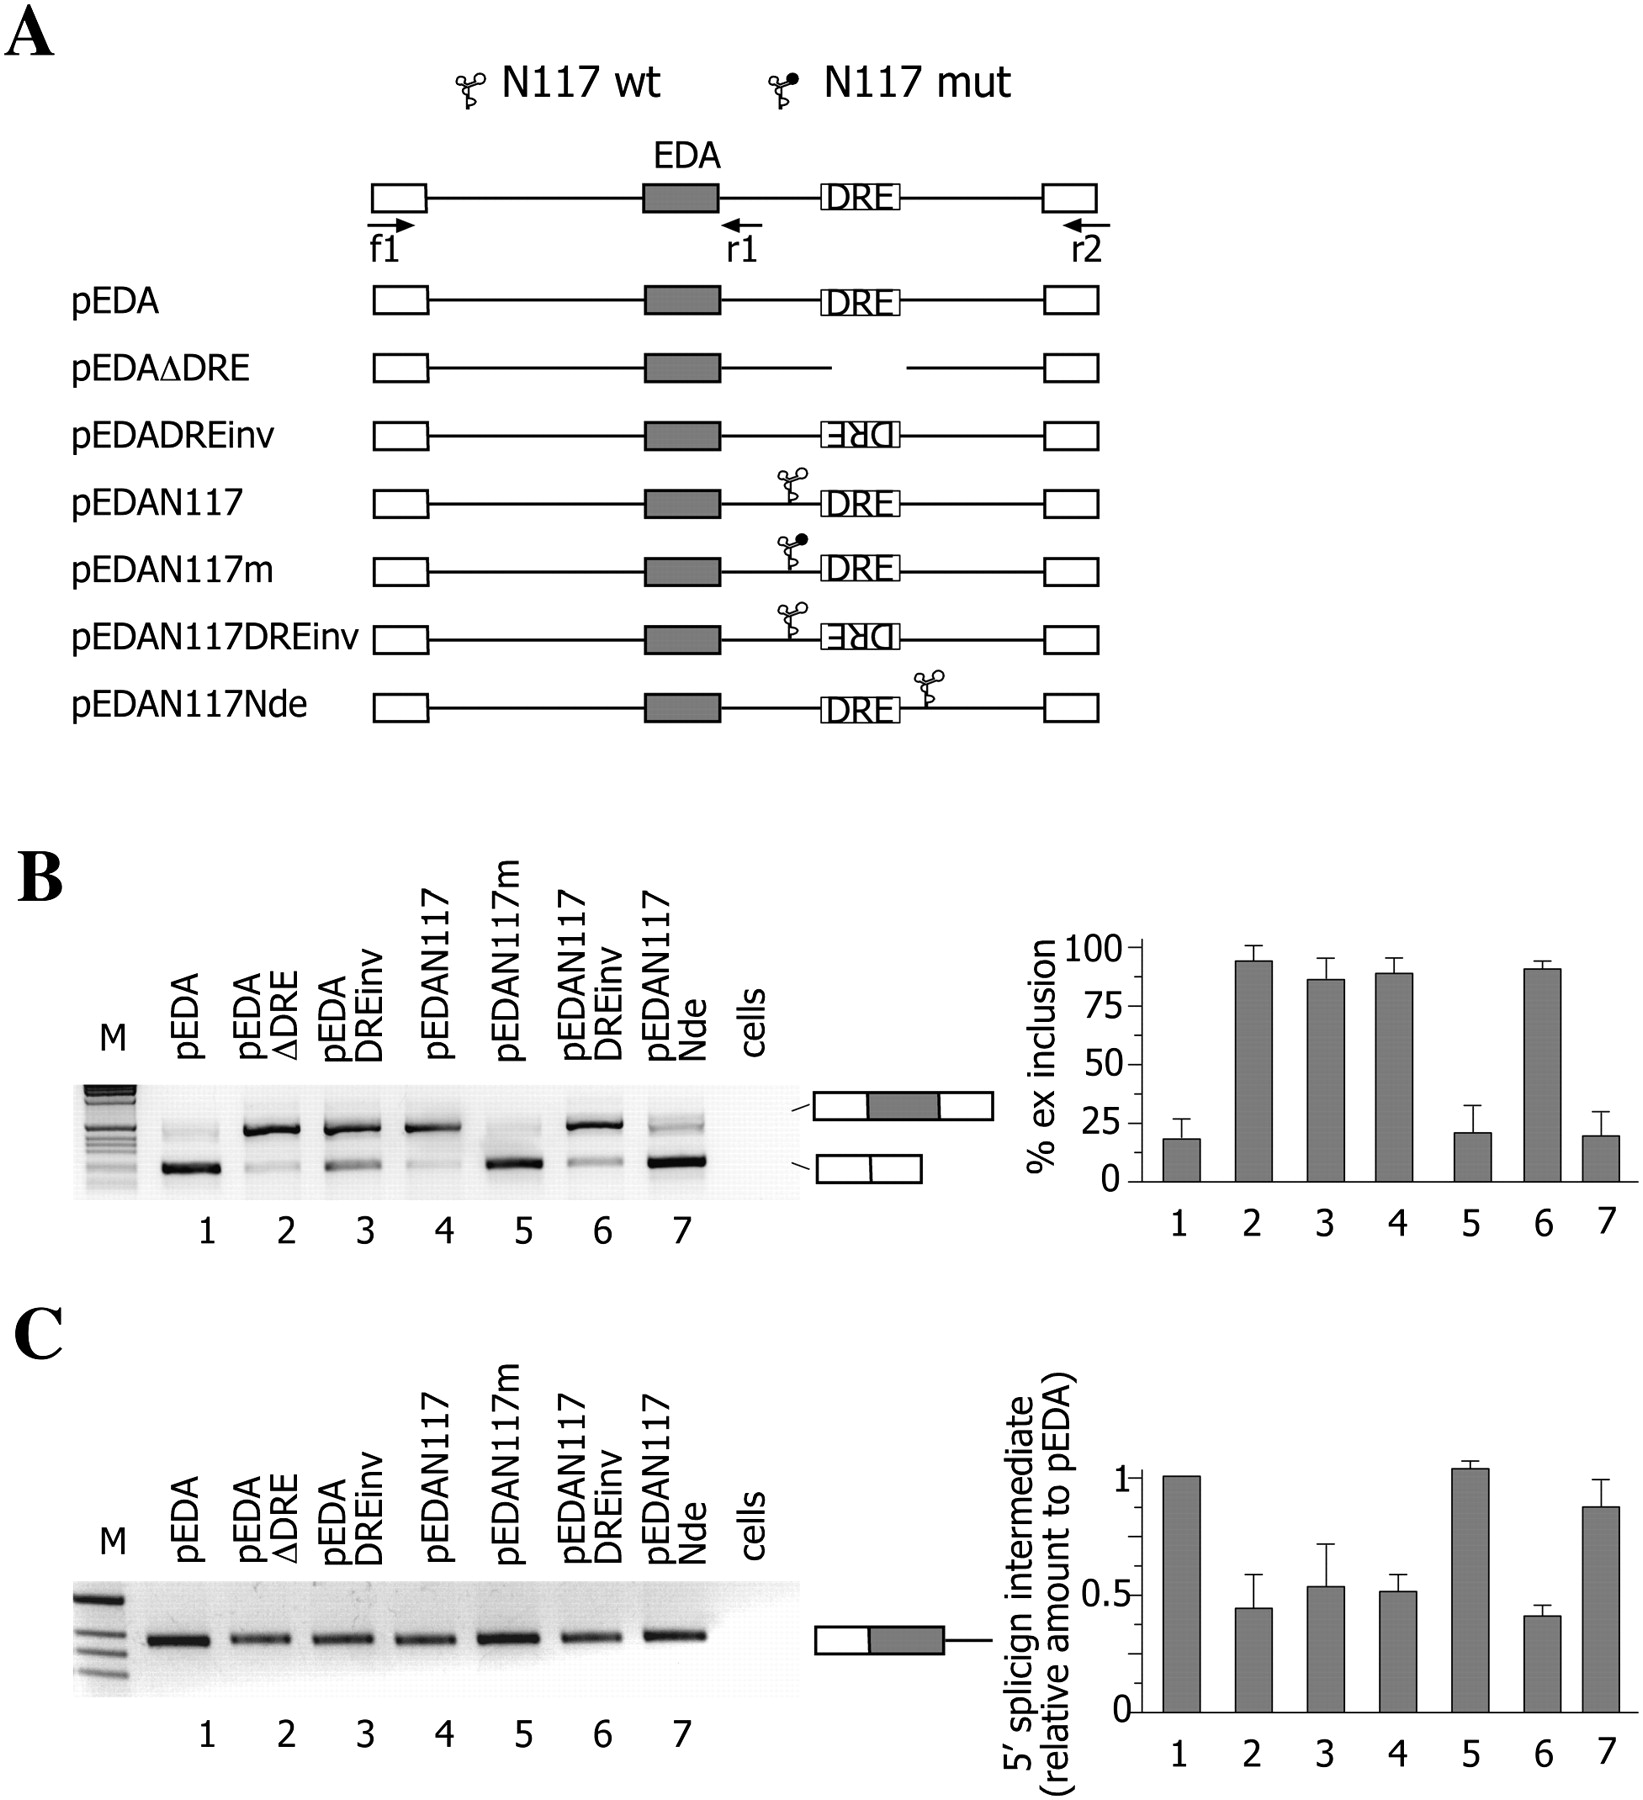
The N117 ribozyme facilitates splicing of the downstream intron in a DRE-dependent manner. (A) Diagram of the pEDA minigenes. The position of the ribozyme (wild-type [WT] or mutant) and of the DRE sequence is indicated. (Arrows) The locations of primers used in RT-PCR analysis. Exonic sequences are boxed. (B) Analysis of mature spliced transcripts. Minigenes (0.5 μg) were transfected into Hep3B cells and the pattern of splicing evaluated using f1 and r2 primers. (M) The 1-kb molecular weight marker. The identity of the splicing products is schematically reported on the right of the panel. The histogram shows the percentage of EDA exon inclusion. Data represent the mean ± SD of three independent experiments performed in duplicates. (C) Analysis of 5′ splicing intermediates. Minigenes (0.5 μg) were transfected into Hep3B cells along with 0.1 μg of pCF1 plasmid, which was used as control for normalization of transfection and reverse transcriptase efficiencies. RT-PCR was carried out with a1 and r1 primers and amplification products resolved on 2% agarose gel. The identity of the band is indicated on the right of the panel. The histogram shows the relative amount of EDA 5′-splicing intermediates expressed as normalized ratio to pEDA. Calculations show mean ± SD at two independent experiments done in duplicate. Real-time PCR was carried out on pCF1 transcript to assess transfection efficiency (see Materials and Methods).




