


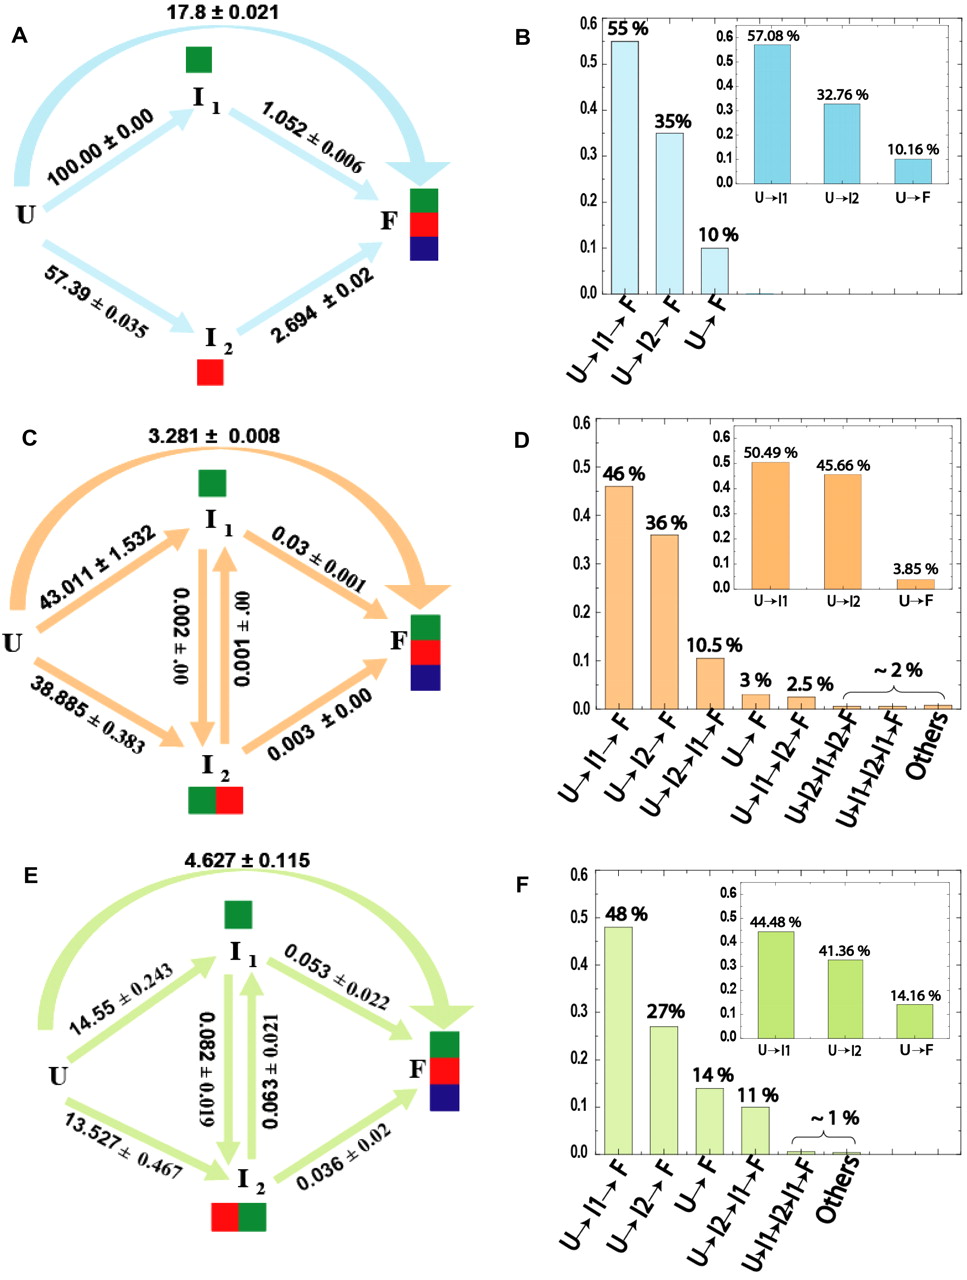
Kinetic folding models and flux analysis. Folding model topologies (left) and flux of folding molecules through the dominant pathways (right) for the Twort (A,B), Azoarcus (C,D), and Tetrahymena (E,F) ribozymes, respectively, as derived from KinFold analysis. U, I, and F refer to the unfolded, intermediate, and folded species, respectively. The resolved microscopic rate constants are indicated for each step of a folding pathway. In the three left panels, the green, red and blue colored boxes, associated with the intermediates (I1, I2) and the folded species (F), represent the cluster affiliation of tertiary contacts formed in the corresponding species. In the three right panels, each histogram represents the percentage of folding molecules traversing the pathway indicated below it. The insets of B, D, and F show the initial flux partitioning for the corresponding ribozymes.




